| Source | Facilities | Total ADP |
|---|---|---|
| ICE FY26 annual stats | 220 | 67139 |
| DDP daily average | 563 | 69696 |
Unreported Detention: ICE Facilities in FY 2026
An analysis of ICE detention statistics not included in the February 2026 annual detention report
Comparing the Deportation Data Project’s daily detention counts with ICE’s published FY 2026 annual statistics to identify unreported facilities and track population changes
Overview
This page analyzes ICE detention during the first months of fiscal year 2026, comparing two data sources:
ICE FY 2026 annual detention statistics, released February 12, 2026, with data through February 5, 2026. Published at the ICE Detention Management Division, the spreadsheet covers 220 facilities.
Deportation Data Project daily population data, government data obtained by FOIA and archived by the Deportation Data Project. The dataset covers every ICE detention facility with reported daily counts from October 2022 through March 10, 2026.
Significantly, both of these are government-generated datasets, provided more and less willingly (respectively) by Immigration and Customs Enforcement. Where doing comparisons below, we focus on the October 1, 2025 – February 12, 2026 period covered by the ICE FY 2026 spreadsheet. Where summarizing detention as a whole, and in drawing the sparkline graphs for each facility on the map, we go as far as the DDP allows.
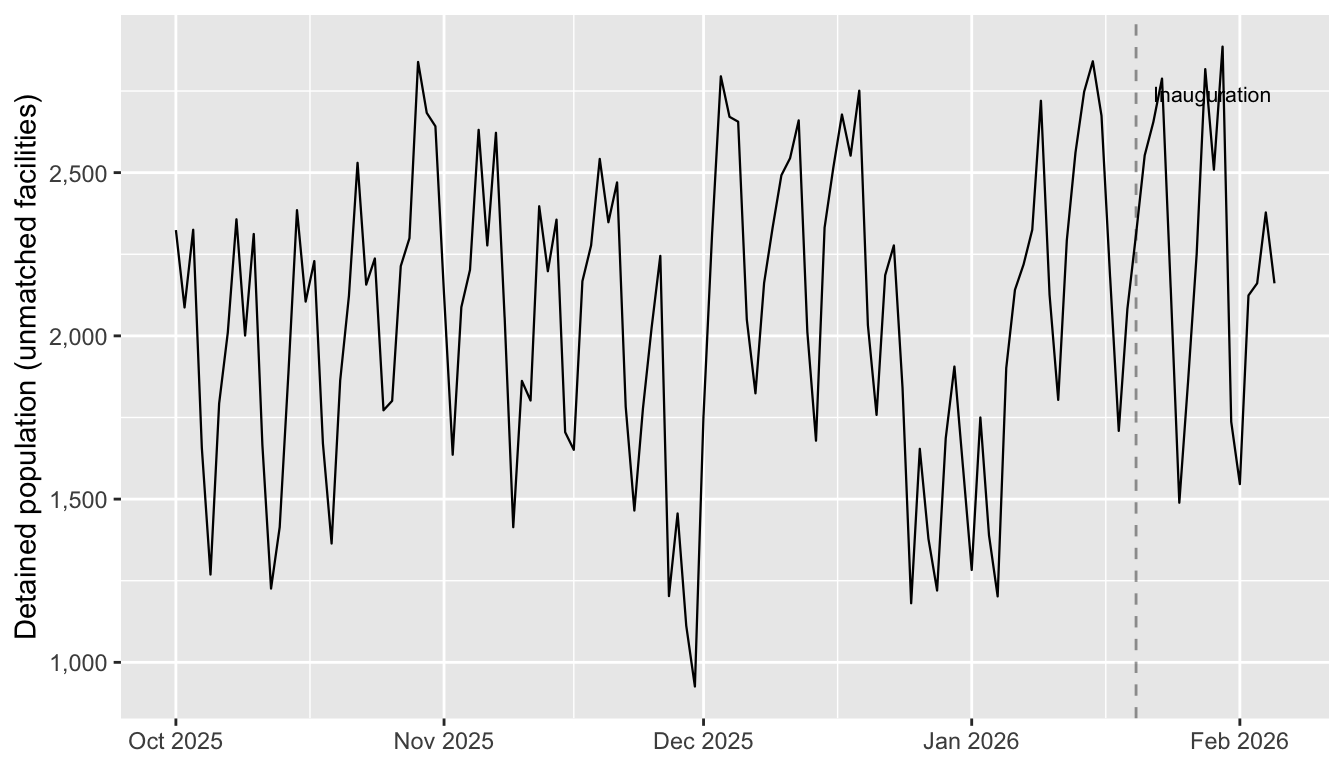
As with FY 2025, the DDP data reveals a substantial unreported detention population — facilities where ICE holds people that do not appear in the published annual statistics. Over this period, the unreported population reached a peak of over 2,500 individuals on a single day. Medical facilities, which accounted for about 68 detainees per day in FY 2025, have been excluded from this dataset.
In FY 2026, it is Hold Rooms and other Staging facilities that account for the vast majority of the unreported population. For comparison, hold facilties in FY 2025 had an average daily population of about 1,163 detainees, with an average of 1,986 in the final 60 days.
This analysis is partial in that a small handful of “Unclassified” facilities may have ICE matches which are still being added manually, but you can see if Figure 4 that this is a negligible part of the total.
Aggregate comparison
The ICE FY 2026 spreadsheet covers October 1, 2025 through February 5, 2026 — 128 days. To compare with the DDP data we compute average daily population (ADP) over that same window.
The DDP covers 563 facility codes with at least one detainee during this period, compared to 220 in the ICE spreadsheet. On average, 2,557 more detainees per day appear in the DDP data than in ICE’s published figures.
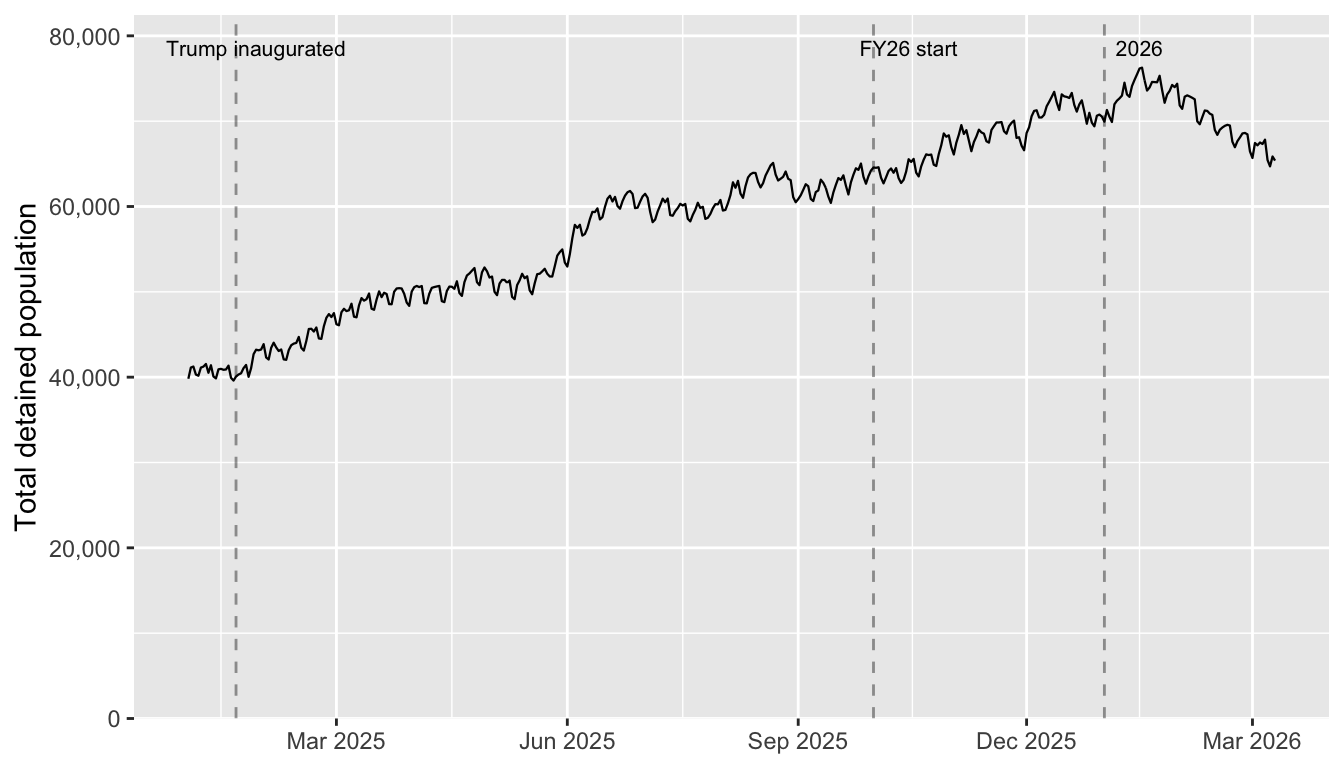
Daily population over time
Facility-level matching
| Category | Value |
|---|---|
| In both sources | 216 |
| ICE only (no DDP match) | 4 |
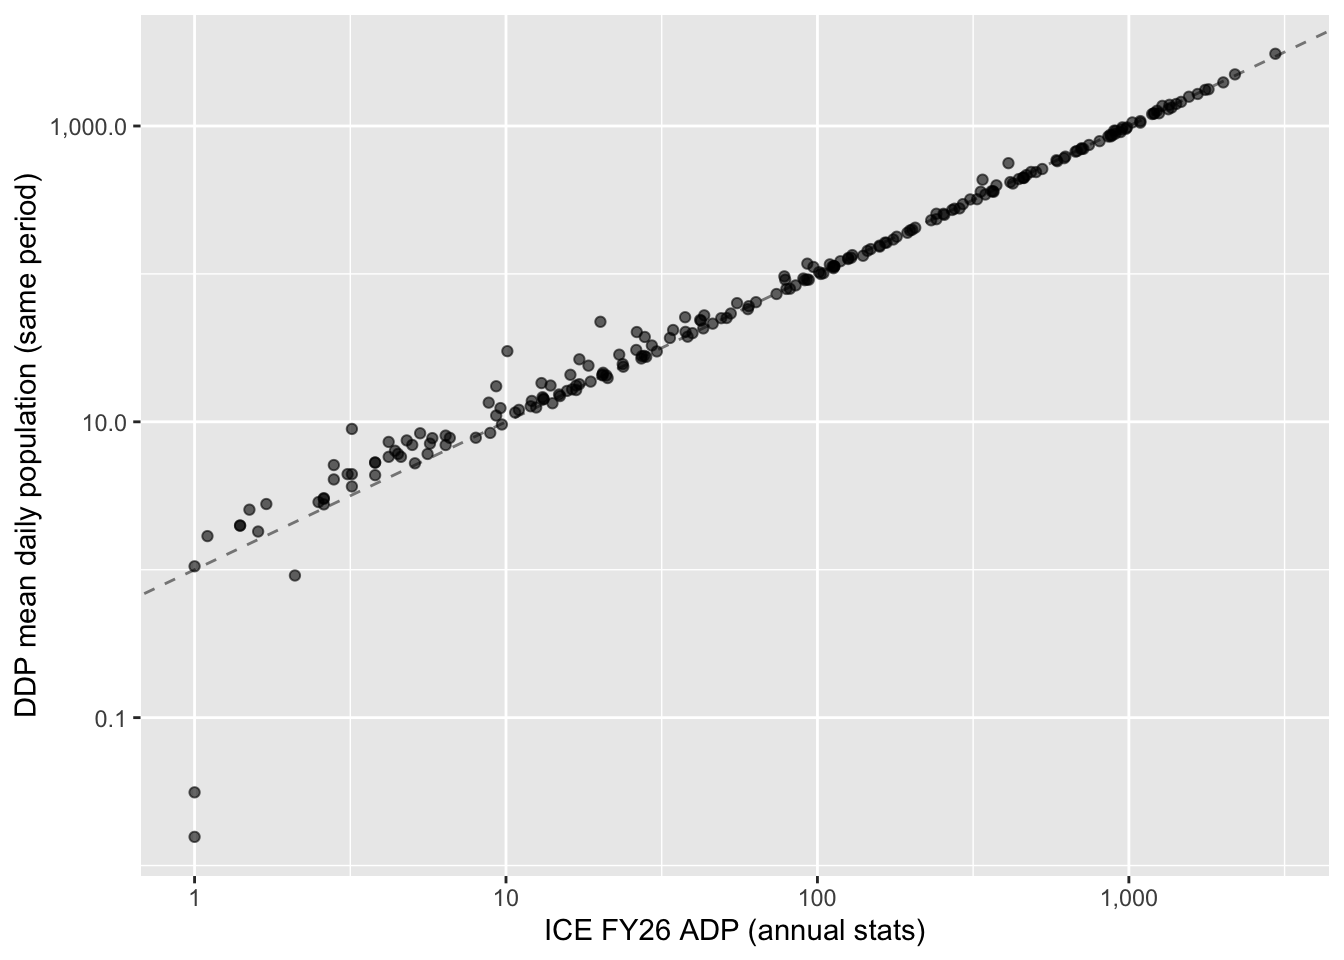
| Matched: ICE total ADP | 67121 |
| Matched: DDP total ADP | 67619 |
| Matched: aggregate difference | 498 (0.74%) |
Facility-level agreement
| Agreement band | Facilities |
|---|---|
| Within 10% | 153 |
| Within 25% | 22 |
| Within 50% | 24 |
| >50% difference | 17 |
| Public-facing report shows greater value | 89 |
Among the 216 matched facilities with nonzero ADP in both sources, 153 agree within 10%. There are 89 facilities with a lower count in DDP than in the ICE spreadsheet.
| ID | Facility | ICE ADP |
|---|---|---|
| 372 | Victoria County Jail | 14 |
| 1212 | Scott County Detention. Facility | 2 |
| 402 | Lafayette Parish Correctional Center | 1 |
| 1211 | Sarasota County Jail | 1 |
4 ICE FY26 facilities have no matching DDP facility code.
Unmatched facilities
345 of 563 DDP facility codes do not appear in the ICE FY 2026 annual statistics. These are facilities where ICE holds detainees but which are excluded from the published spreadsheet.
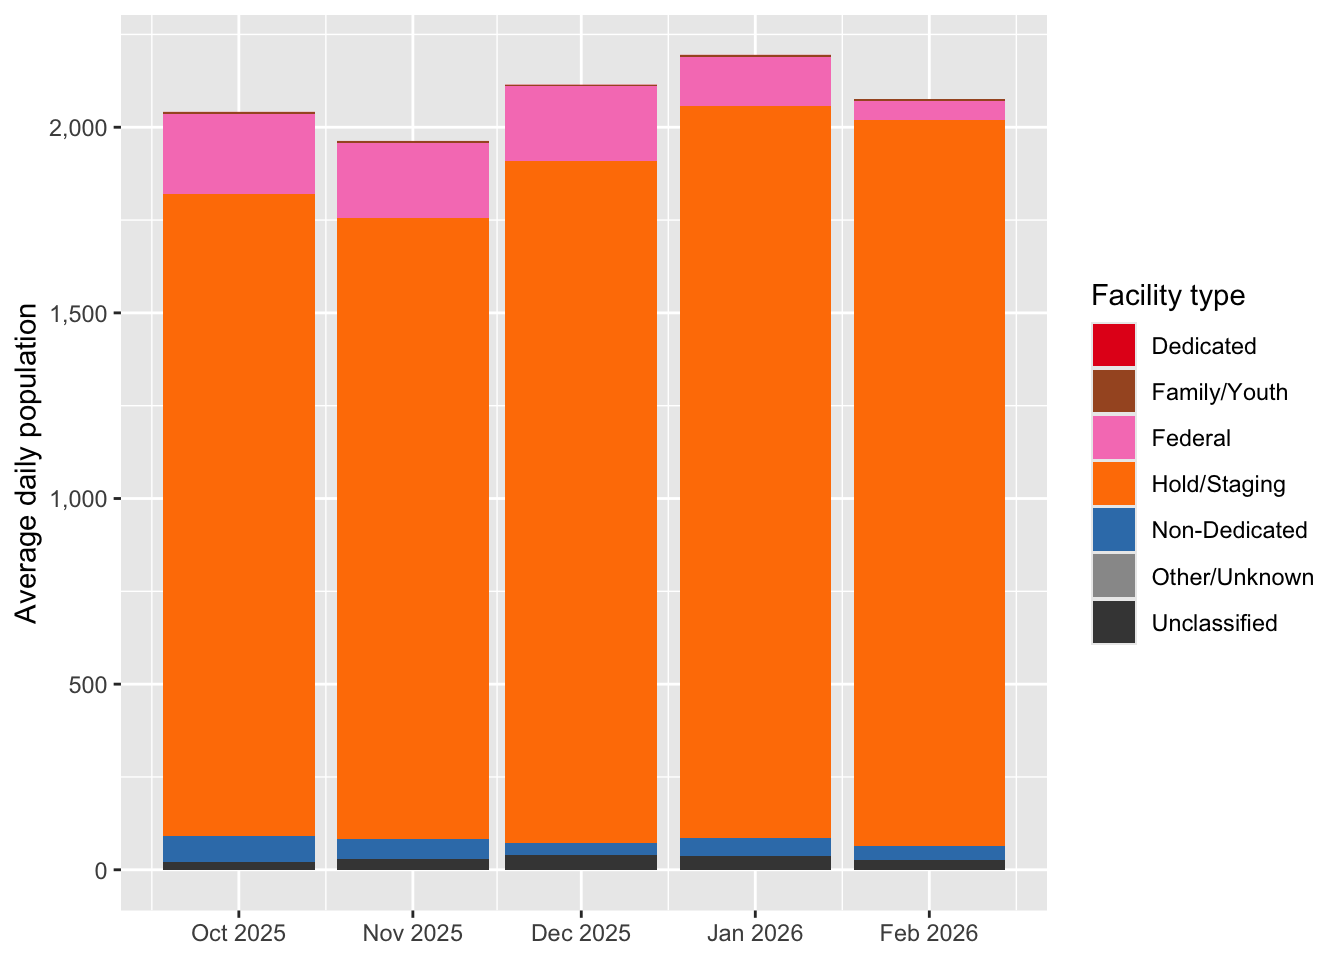
By facility type
Facility types are drawn from the Vera Institute’s classification system. “Dedicated” facilities are purpose-built or contractually dedicated to ICE detention. “Non-Dedicated” are county jails and other facilities that also hold ICE detainees. “Hold/Staging” are short-term ERO processing rooms. “Federal” includes BOP prisons and USMS facilities.
| Facility type | Peak class | Facilities | Period ADP |
|---|---|---|---|
| Hold/Staging | Peak ≥ 2 | 152 | 1809 |
| Federal | Peak ≥ 2 | 32 | 182 |
| Non-Dedicated | Peak ≥ 2 | 37 | 48 |
| Unclassified | Peak ≥ 2 | 25 | 29 |
| Family/Youth | Peak ≥ 2 | 3 | 4 |
| Non-Dedicated | Peak < 2 | 37 | 3 |
| Unclassified | Peak < 2 | 24 | 2 |
| Federal | Peak < 2 | 16 | 1 |
| Dedicated | Peak < 2 | 4 | 0 |
| Dedicated | Peak ≥ 2 | 2 | 0 |
| Family/Youth | Peak < 2 | 1 | 0 |
| Hold/Staging | Peak < 2 | 12 | 0 |
| Other/Unknown | Peak < 2 | 1 | 0 |
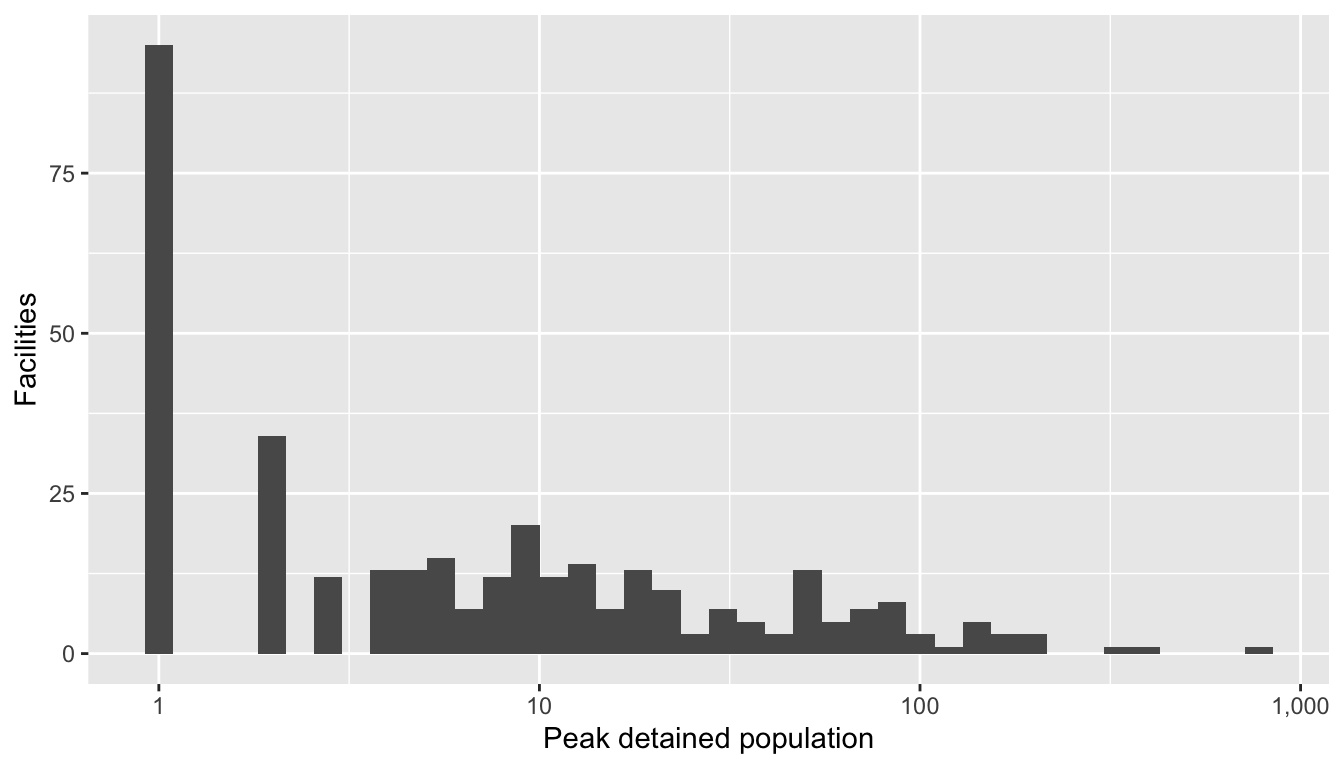
The 346 unmatched facilities account for an average daily population of 2,079 over the October 2025 – February 5, 2026 period. 95 facilities never had more than one detainee at a time, collectively contributing 6.9 ADP.
Daily population in unmatched facilities
Peak population by facility
| Facility | City | State | Type | Peak pop. | Peak date | Mean ADP |
|---|---|---|---|---|---|---|
| AZ REM OP COORD CENTER (AROCC) | MESA | AZ | Hold/Staging | 777 | 2026-01-28 | 150 |
| BISHOP HENRY WHIPPLE FED BLDG | Fort Snelling | MN | Hold/Staging | 362 | 2026-01-09 | 65 |
| BROADVIEW SERVICE STAGING | BROADVIEW | IL | Hold/Staging | 326 | 2025-11-01 | 78 |
| DALLAS F.O. HOLD | Dallas | TX | Hold/Staging | 213 | 2025-10-23 | 97 |
| BALTIMORE HOLD ROOM | Baltimore | MD | Hold/Staging | 209 | 2026-01-23 | 96 |
| LOS CUST CASE | Los Angeles | CA | Hold/Staging | 208 | 2025-12-18 | 89 |
| BOSTON HOLDROOM | Burlington | MA | Hold/Staging | 164 | 2026-01-23 | 40 |
| MONTGOMERY HOLD RM | Conroe | TX | Hold/Staging | 162 | 2026-01-13 | 78 |
| PHOENIX DIST OFFICE | Phoenix | AZ | Hold/Staging | 155 | 2025-12-03 | 64 |
| CHARLOTTE HOLD ROOM | CHARLOTTE | NC | Hold/Staging | 145 | 2025-11-17 | 30 |
| INDIANAPOLIS HOLD ROOM | INDIANAPOLIS | IN | Hold/Staging | 142 | 2025-10-29 | 43 |
| SAN ANTONIO DRO HOLD ROOM | San Antonio | TX | Hold/Staging | 139 | 2026-01-30 | 46 |
| LAREDO DETENTION CENTER HOLD ROOM | LAREDO | TX | Hold/Staging | 134 | 2025-12-07 | 27 |
| ATLANTA DIST. HOLD RM | Atlanta | GA | Hold/Staging | 131 | 2025-10-03 | 86 |
| RICHMOND SUB-OFFICE HOLD | RICHMOND | VA | Hold/Staging | 126 | 2025-10-22 | 31 |
| MIAMI (MIRAMAR) HOLD ROOM | Miramar | FL | Hold/Staging | 108 | 2025-11-21 | 55 |
| ORLANDO HOLD ROOM | ORLANDO | FL | Hold/Staging | 100 | 2025-12-19 | 48 |
| KROME HOLD ROOM | MIAMI | FL | Hold/Staging | 94 | 2025-11-11 | 2 |
| MARION COUNTY JAIL | Indianapolis | IN | Federal | 89 | 2025-10-15 | 51 |
| TAMPA HOLD ROOM | TAMPA | FL | Hold/Staging | 87 | 2025-10-27 | 41 |