Code
library(dplyr)
library(tidyr)
library(ggplot2)
library(scales)
library(knitr)
library(sf)
library(leaflet)
library(leafpop)
library(kableExtra)
library(leaflet.extras)An analysis of ICE detention statistics not included in the FY 2025 annual detention report
This page offers an analysis of two forms of data on the population of people held by US Immigration and Customs Enforcement (ICE): summary data on detention published by ICE on its website and a detailed and granular dataset of arrests, removals, and overnight populations under ICE custody, released under the Freedom of Information Act and archived by the Deportation Data Project.
The former data, is published online the ICE Detention Management Division. I have also produced a map of reported facilities based on sixteen years of reporting (eight annual reports and two summary sheets) from ICE.
The newer data covers “every ICE encounter, detainer request, arrest, book-in to detention, and removal” between September 1, 2022 and October 15, 2025.
As becomes clear below, the more extensive data shows that ICE’s public reporting is incomplete, and the uncounted population grew massively during 2025, from hundreds of individuals per night in the final months of the Biden administration to as many as forty-five hundred individuals, and frequently in excess of three thousand in summer and early fall 2025. This unreported network includes over ICE-owned holding facilities, nine dedicated ICE detention centers, local jail and state prisons, federal prisons, and over 200 medical facilities.
The FOIA-supplied data also exceeds ICE’s annual reporting in those facilities that do match by 1,038 detainees per night over the course of FY 2025, though this only amounts to 2% of the total population.
In much oyf this report, facility-level summaries distinguish between facilities with Peak Population ≥ 2 and those with Peak Population < 2. Facilities with no more than one detainees at a time account for many DDP facility codes but negligible population. Separating them keeps attention on facilities with substantive detention activity.
This page is part of a larger data project to gather, summarize, and analyze public data about immigration enforcement in the United States. The focus here is detention facilities used by US Immigration and Customs Enforcement (ICE).
library(dplyr)
library(tidyr)
library(ggplot2)
library(scales)
library(knitr)
library(sf)
library(leaflet)
library(leafpop)
library(kableExtra)
library(leaflet.extras)# Pre-computed data from the ice-detention pipeline.
# Run copy-data.sh to refresh from the pipeline project.
ice_fy25 <- readRDS("data/ice_fy25.rds")
ddp_fy25 <- readRDS("data/ddp_fy25.rds")
ddp_fy25_keyed <- readRDS("data/ddp_fy25_keyed.rds")
daily_totals <- readRDS("data/daily_totals.rds")
unmatched <- readRDS("data/unmatched.rds")
daily_unmatched <- readRDS("data/daily_unmatched.rds")
monthly_unmatched <- readRDS("data/monthly_unmatched.rds")
peak_fy25 <- readRDS("data/peak_fy25.rds")
biden_unmatched <- readRDS("data/biden_unmatched.rds")
trump_unmatched <- readRDS("data/trump_unmatched.rds")
daily_unreported <- readRDS("data/daily_unreported.rds")The DDP data (Deportation Data Project) provides daily facility-level detention counts. To compare with the ICE FY25 annual statistics, we average DDP daily counts from October 1, 2024 through September 24, 2025—the date stamp on the FY25 spreadsheet. On average, the DDP data reflects 2581 more detainees per day than reported in the ICE FY25 annual statistics. As we’ll see below, about 1,000 of these detainees are in facilities that appear in both sources but with higher counts in the DDP data. The rest are in facilities that do not appear at all in the ICE FY25 spreadsheet, accounting for a full-year average of roughly fifteen-hundred detainees per day. However, since the unmatched population grew dramatically during 2025, the daily unmatched population was much higher towards the end of the year.
tibble(
  Source      = c("ICE FY25 annual stats", "DDP daily average"),
  Facilities  = c(nrow(ice_fy25), nrow(ddp_fy25)),
  `Total ADP` = c(round(sum(ice_fy25$ice_adp, na.rm = TRUE)),
                   round(sum(ddp_fy25$ddp_adp)))
) |>
kable()| Source | Facilities | Total ADP |
|---|---|---|
| ICE FY25 annual stats | 189 | 47549 |
| DDP daily average | 768 | 50130 |
The DDP covers 768 facility codes while the ICE spreadsheet lists 189 facilities. The DDP’s higher total reflects the many additional facilities (hold rooms, federal prisons, medical facilities) not included in the ICE annual statistics.
fy_breaks <- as.Date(c("2023-10-01", "2024-10-01", "2025-10-01"))
fy_labels <- data.frame(
  x = as.Date(c("2024-04-01", "2025-04-01", "2025-10-08")),
  label = c("FY24", "FY25", "FY26")
)

ggplot(daily_totals, aes(x = date, y = total_pop)) +
  geom_line(linewidth = 0.3) +
  geom_vline(xintercept = fy_breaks, linetype = "dashed", alpha = 0.4) +
  # Annual averages as calculated as follows
  # facilities_aggregated$FY24$sum_criminality_levels |> sum()
  # 36276.8
  # facilities_aggregated$FY25$sum_criminality_levels |> sum()
  # 47550.2
  # facilities_aggregated$FY26$sum_criminality_levels |> sum() # taken with February 2026 data
  # 66811.9
  # geom_segment(x=as.Date("2023-10-01"), xend=as.Date("2024-10-01"),
  #              y=36276.8, linetype = "dashed", alpha = 0.4, linewidth=0.1, color = "blue") +
  # geom_segment(x=as.Date("2024-10-01"), xend=as.Date("2025-10-01"),
  #              y=47550.2, linetype = "dashed", alpha = 0.4, linewidth=0.1, color = "blue") +
  # geom_segment(x=as.Date("2025-10-01"), xend=as.Date("2025-11-01"),
  #              y=66811.9, linetype = "dashed", alpha = 0.4, linewidth=0.3, color = "blue") +
  geom_text(data = fy_labels, aes(x = x, y = max(daily_totals$total_pop) * 1.04,
                                   label = label), inherit.aes = FALSE, size = 3) +
  scale_y_continuous(labels = comma) +
  labs(x = NULL, y = "Total detained population")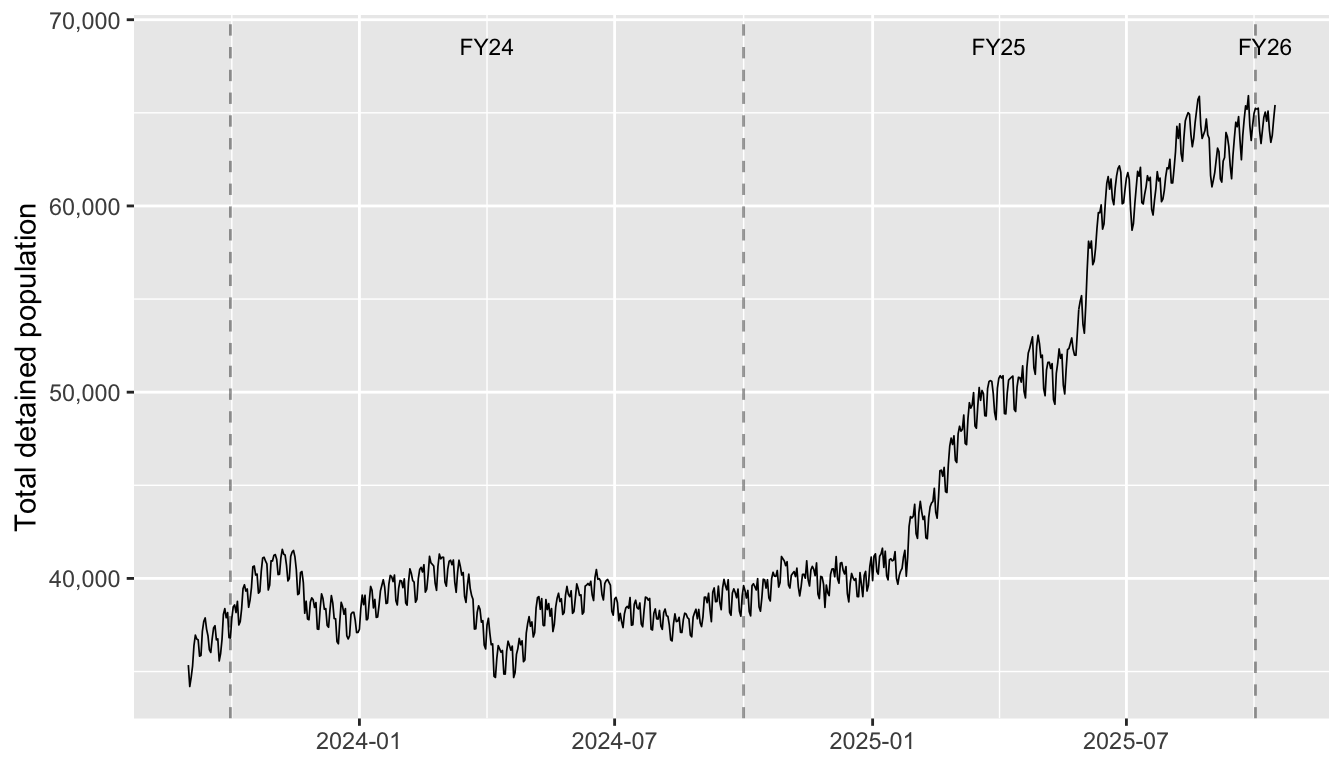
ICE uses detainee locator codes, or DETLOCs to keep track of which facilities detainees are housed in. These codes are included in 2015 and 2017 facility lists (describing ICE detention populations from FY 2010 to 2017), in a list maintained by the Deportation Data Project, and in separate lists compiled by the Vera Institute and The Marshall Project. Our data wrangling matched the FY 2019-2026 data to these other lists by exact facility name, address, city and state, and other criteria. All 189 detention facilities listed in the ICE spreadsheet for FY2025 have one or more known DETLOC.
We join the two datasets through canonical facility IDs. Each DDP facility code is mapped to a canonical ID via detloc_lookup_full, which preserves all DETLOC variants from every source (DMCP, DDP, hold/ERO, Vera). Some canonical facilities have multiple codes—for example, Central Arizona Florence Correctional Complex uses CCADCAZ (DMCP) and CCAFLAZ (DDP), and Delaney Hall uses ESSEXNJ (DMCP) and DHDFNJ (DDP). Using the full lookup ensures all codes contribute ADP to the correct facility.
# Aggregate DDP by canonical_id for matched facilities.
ddp_by_canonical <- ddp_fy25_keyed |>
  filter(in_ice_fy25) |>
  group_by(canonical_id) |>
  summarise(ddp_adp = sum(ddp_adp), .groups = "drop")

comparison <- ice_fy25 |>
  # ICE FY25 can have multiple rows per canonical_id (e.g., Adelanto + Desert View Annex)
  group_by(canonical_id) |>
  summarise(
    canonical_name = first(canonical_name),
    ice_adp = sum(ice_adp, na.rm = TRUE),
    .groups = "drop"
  ) |>
  full_join(ddp_by_canonical, by = "canonical_id") |>
  mutate(
    in_ice = !is.na(ice_adp),
    in_ddp = !is.na(ddp_adp),
    diff   = ddp_adp - ice_adp,
    pct_diff = diff / ice_adp * 100
  )

matched <- comparison |> filter(in_ice & in_ddp)

tibble(
  Category = c("In both sources", "ICE only (no DDP match)",
               "Matched: ICE total ADP", "Matched: DDP total ADP",
               "Matched: aggregate difference"),
  Value = c(
    sum(comparison$in_ice & comparison$in_ddp),
    sum(comparison$in_ice & !comparison$in_ddp),
    round(sum(matched$ice_adp, na.rm = TRUE)),
    round(sum(matched$ddp_adp, na.rm = TRUE)),
    paste0(round(sum(matched$ddp_adp, na.rm = TRUE) -
                   sum(matched$ice_adp, na.rm = TRUE)),
           " (", round((sum(matched$ddp_adp, na.rm = TRUE) /
                           sum(matched$ice_adp, na.rm = TRUE) - 1) * 100, 2), "%)")
  )
) |>
kable()| Category | Value |
|---|---|
| In both sources | 188 |
| ICE only (no DDP match) | 0 |
| Matched: ICE total ADP | 47549 |
| Matched: DDP total ADP | 48586 |
| Matched: aggregate difference | 1037 (2.18%) |
both_nonzero <- matched |> filter(ice_adp > 0, ddp_adp > 0)

ggplot(both_nonzero, aes(x = ice_adp, y = ddp_adp)) +
  geom_abline(slope = 1, intercept = 0, linetype = "dashed", alpha = 0.5) +
  geom_point(alpha = 0.6) +
  scale_x_log10(labels = comma) +
  scale_y_log10(labels = comma) +
  labs(x = "ICE FY25 ADP (annual stats)", y = "DDP mean daily population")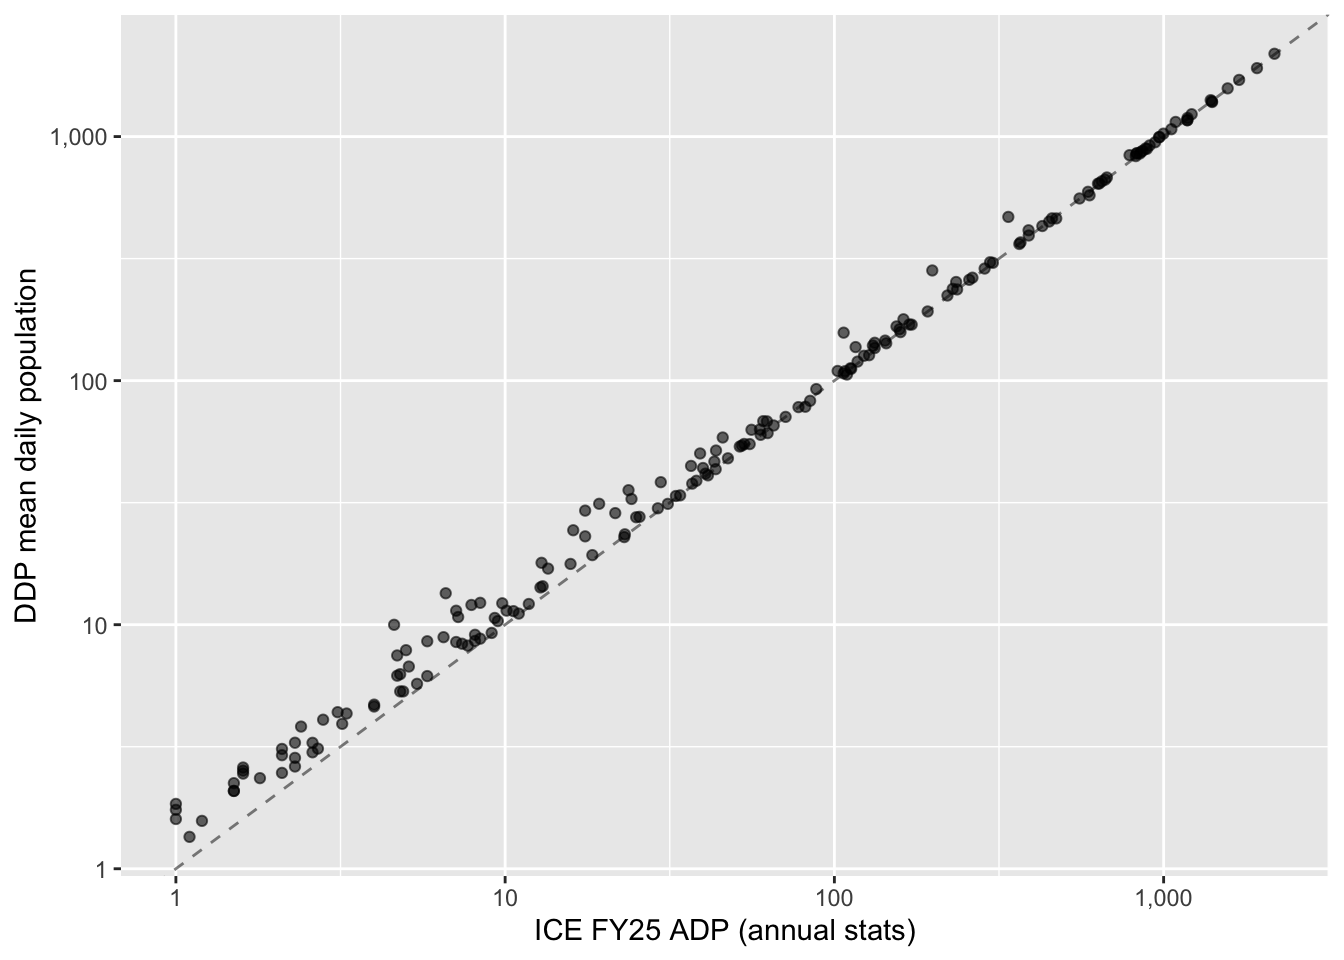
tibble(
  `Agreement band` = c("Within 10%", "Within 25%", "Within 50%", ">50% difference", "Annual report shows greater value"),
  Facilities = c(
    sum(abs(both_nonzero$pct_diff) <= 10),
    sum(abs(both_nonzero$pct_diff) > 10 & abs(both_nonzero$pct_diff) <= 25),
    sum(abs(both_nonzero$pct_diff) > 25 & abs(both_nonzero$pct_diff) <= 50),
    sum(abs(both_nonzero$pct_diff) > 50),
    sum(both_nonzero$pct_diff < 0)
  )
) |>
kable()| Agreement band | Facilities |
|---|---|
| Within 10% | 115 |
| Within 25% | 26 |
| Within 50% | 30 |
| >50% difference | 17 |
| Annual report shows greater value | 24 |
Among the 188 matched facilities with nonzero ADP in both sources, 115 agree within 10%. The log-scale correlation is 0.998. There are 24 facilities with a lower count in the DDP data and the largest percentage difference in this direction is -4.2%.
ice_only <- comparison |> filter(in_ice & !in_ddp)
if (nrow(ice_only) > 0) {
  ice_only |>
    select(canonical_id, canonical_name, ice_adp) |>
    mutate(ice_adp = round(ice_adp)) |>
    arrange(desc(ice_adp)) |>
    kable(col.names = c("ID", "Facility", "ICE ADP"))
}
All ICE FY25 facilities have a matching DDP facility code.
576 of 768 DDP facility codes do not appear in the ICE FY25 annual statistics. These are facilities where ICE holds detainees but which are excluded from the published spreadsheet.
Facility types are drawn from the Vera Institute’s classification system. “Dedicated” facilities are purpose-built or contractually dedicated to ICE detention. “Non-Dedicated” are county jails and other facilities that also hold ICE detainees. “Hold/Staging” are short-term ERO processing rooms. “Federal” includes BOP prisons and USMS facilities.
unmatched |>
  group_by(type_grouped, peak_class) |>
  summarise(
    Facilities = n(),
    `FY25 ADP` = round(sum(ddp_adp)),
    .groups = "drop"
  ) |>
  arrange(desc(`FY25 ADP`)) |>
kable(col.names = c("Facility type", "Peak class", "Facilities", "FY25 ADP"))| Facility type | Peak class | Facilities | FY25 ADP |
|---|---|---|---|
| Hold/Staging | Peak ≥ 2 | 169 | 1163 |
| Dedicated | Peak ≥ 2 | 2 | 170 |
| Unclassified | Peak ≥ 2 | 135 | 140 |
| Federal | Peak ≥ 2 | 24 | 31 |
| Non-Dedicated | Peak ≥ 2 | 23 | 30 |
| Unclassified | Peak < 2 | 185 | 6 |
| Non-Dedicated | Peak < 2 | 14 | 2 |
| Medical | Peak ≥ 2 | 1 | 1 |
| Family/Youth | Peak < 2 | 1 | 0 |
| Family/Youth | Peak ≥ 2 | 1 | 0 |
| Federal | Peak < 2 | 13 | 0 |
| Hold/Staging | Peak < 2 | 7 | 0 |
| Medical | Peak < 2 | 1 | 0 |
The 576 unmatched facilities account for a full-year ADP of roughly 1,544. There were 475 facilites that averaged fewer than 2 detainees per day, contributing 136 ADP in total. Among them, 221 facilities never had more than 1 detainee per day, contributing 8 ADP in total.
ggplot(daily_unmatched, aes(x = date, y = total_pop)) +
  geom_line(linewidth = 0.3) +
  scale_y_continuous(labels = comma) +
  scale_x_date(date_labels = "%b %Y", date_breaks = "2 months") +
  labs(x = NULL, y = "Detained population (unmatched facilities)")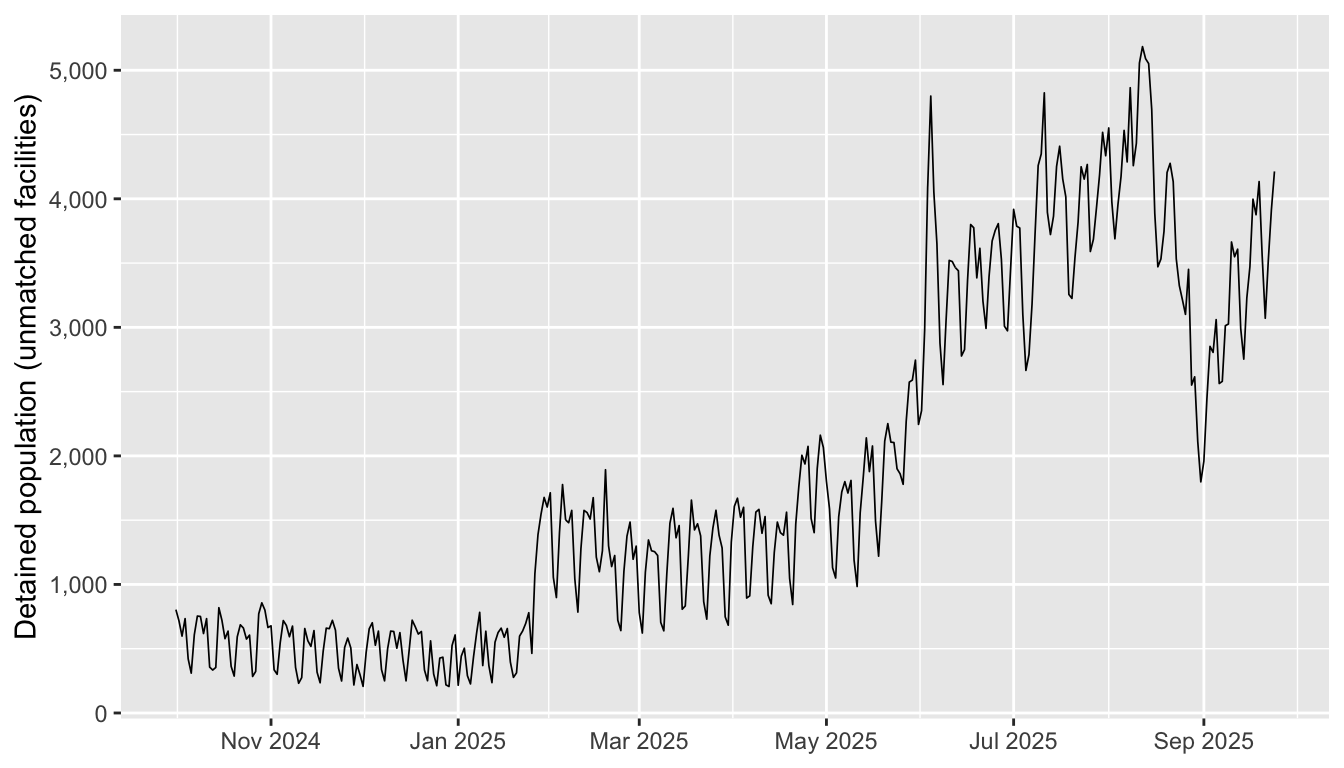
monthly_by_type <- monthly_unmatched |>
  group_by(month, type_grouped) |>
  summarise(daily_avg = sum(n_detained) / n_distinct(date), .groups = "drop")

ggplot(monthly_by_type, aes(x = month, y = daily_avg, fill = type_grouped)) +
  geom_col() +
  scale_y_continuous(labels = comma) +
  scale_x_date(date_labels = "%b %Y", date_breaks = "2 months") +
  labs(x = NULL, y = "Average daily population", fill = "Facility type")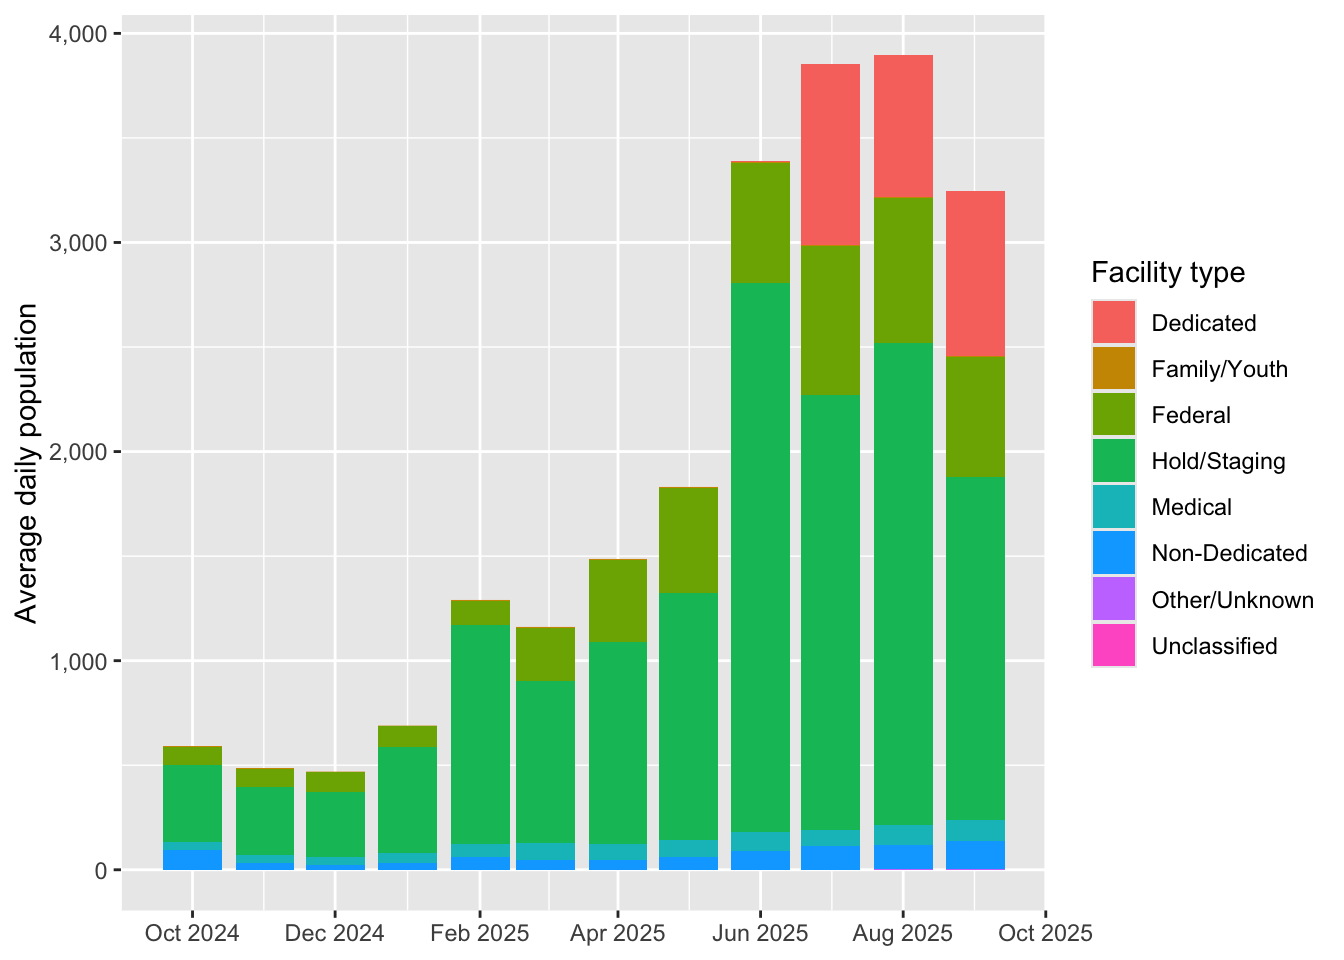
The final 60 days of the FY25 data window (July 27 – September 24, 2025) capture the period of peak detention.
last60_start <- as.Date("2025-07-27")
last60_end   <- as.Date("2025-09-24")

last60 <- monthly_unmatched |>
  filter(date >= last60_start, date <= last60_end)

non_empty <- last60 |>
  group_by(detention_facility_code) |>
  summarise(total_detained = sum(n_detained), .groups = "drop") |>
  filter(total_detained > 0)

last60_by_type <- last60 |>
  filter(detention_facility_code %in% non_empty$detention_facility_code) |>
  group_by(type_grouped) |>
  summarise(
    Facilities = n_distinct(detention_facility_code),
    `Daily avg` = round(sum(n_detained) / n_distinct(date)),
    .groups = "drop"
  ) |>
  arrange(desc(`Daily avg`))

last60_total <- sum(last60_by_type$`Daily avg`)

last60_by_type |>
  rename(`Facility type` = type_grouped) |>
kable()| Facility type | Facilities | Daily avg |
|---|---|---|
| Hold/Staging | 162 | 1987 |
| Dedicated | 2 | 692 |
| Unclassified | 180 | 334 |
| Federal | 30 | 75 |
| Non-Dedicated | 22 | 52 |
| Medical | 2 | 2 |
| Family/Youth | 1 | 0 |
In the last 60 days, 3,142 people per day were held in facilities absent from the ICE FY25 annual statistics.
This table of the facilities with the largest peak population in FY 2025 help us make sense of th unreported population. A variety of different kinds of facilities play a roll:
New Federal facilities like the El Paso Soft-Sided Facility (ELPASOFS), which is distinct from the El Paso Processing Center (EPC) and Camp East Montana (EROFCB), held large numbers of detainees. This new facility was not added to the FY2025 statistics and was supplanted by Camp East Montana before the new fiscal year. The Ursula Centralized Processing Center, formally associated with Customs and Border Patrol, is listed as holding an average of 32 and a mamximum of 463 ICE detainees.
Dedicated ICE detention centers supplied by states, like the Baker Correctional Institution (FLBAKCI), a Florida state prison that was turned over to use by ICE in 2025, and held as many as 294 prisoners in FY 2025. The Florida Soft-Sided Facility (FLDSSFS, also known as Alligator Alcatraz was the sceond largest unreported facility, with a peak population of 1,482 detainees on July 30, 2025. These facilities were added to the FY 2026 statistics but left off the 2025 document.
Holding facilities associated with airports like the Krome Hold Room (KROHOLD) near Miami International Airport. This was one of the few facilities used at a large scale in the final days of the Biden administration. The Arizona Removal Operations Coordination Center (AROCC) operates at the Phoenix-Mesa Gateway Airport. As with other hold rooms, these facilities were reportedly exceeding the 12-hour limit on detention time.
Field Offices and Sub-Offices of the Enforcement and Removal Operations (ERO) division of ICE, which are not designed for long-term detention but which held large numbers of detainees during the surge in 2025. This shift coincided with new ICE guidance authorizing detention up to 72 hours, but preceded the new permission and exceeded its limits.
A handful of local prisons were used to hold ICE detainees en masse, including the Richwood Correctional Center (RICHWOOD) in Louisiana, which held up to 1,200 detainees at a time.
peak_fy25 |>
  arrange(desc(peak_pop)) |>
  head(20) |>
  select(detention_facility, state, type_grouped, peak_pop, peak_date, mean_pop) |>
kable(col.names = c("Facility", "State", "Type", "Peak", "Peak date", "Mean ADP"))| Facility | State | Type | Peak | Peak date | Mean ADP |
|---|---|---|---|---|---|
| EL PASO SOFT SIDED FACILITY | TX | Hold/Staging | 1606 | 2025-08-12 | 243.2 |
| FLORIDA SOFT-SIDED FACILITY-SOUTH | FL | Dedicated | 1482 | 2025-07-30 | 170.3 |
| KROME HOLD ROOM | FL | Hold/Staging | 600 | 2025-02-17 | 36.5 |
| URSULA CENTRALIZED PROCESSING CNTR | TX | Unclassified | 463 | 2025-07-11 | 31.6 |
| LOS CUST CASE | CA | Hold/Staging | 455 | 2025-07-11 | 58.7 |
| BAKER C. I. | FL | Unclassified | 294 | 2025-09-24 | 15.7 |
| RICHMOND SUB-OFFICE HOLD | VA | Hold/Staging | 277 | 2025-09-07 | 16.2 |
| BROADVIEW SERVICE STAGING | IL | Hold/Staging | 245 | 2025-09-20 | 31.7 |
| NYC HOLD ROOM | NY | Hold/Staging | 228 | 2025-06-05 | 40.9 |
| DALLAS F.O. HOLD | TX | Hold/Staging | 225 | 2025-09-18 | 53.1 |
| MONTGOMERY HOLD RM | TX | Hold/Staging | 221 | 2025-08-21 | 50.0 |
| BOSTON HOLDROOM | MA | Hold/Staging | 206 | 2025-05-13 | 18.6 |
| AZ REM OP COORD CENTER (AROCC) | AZ | Hold/Staging | 195 | 2025-04-30 | 37.4 |
| MIAMI STAGING FACILITY | FL | Hold/Staging | 176 | 2025-01-31 | 16.5 |
| ATLANTA DIST. HOLD RM | GA | Hold/Staging | 168 | 2025-06-25 | 42.1 |
| SANTA ANA DRO HOLDROOM | CA | Hold/Staging | 150 | 2025-06-11 | 11.3 |
| SAN ANTONIO DRO HOLD ROOM | TX | Hold/Staging | 145 | 2025-06-04 | 19.6 |
| INDIANAPOLIS HOLD ROOM | IN | Hold/Staging | 130 | 2025-09-19 | 12.3 |
| WASHINGTON FIELD OFFICE | VA | Hold/Staging | 127 | 2025-08-23 | 17.3 |
| ORLANDO HOLD ROOM | FL | Hold/Staging | 126 | 2025-06-04 | 19.6 |
peak_fy25 |>
  filter(peak_pop > 0) |>
  ggplot(aes(x = peak_pop)) +
  geom_histogram(bins = 40) +
  scale_x_log10(labels = comma) +
  labs(x = "Peak detained population (FY25)", y = "Facilities")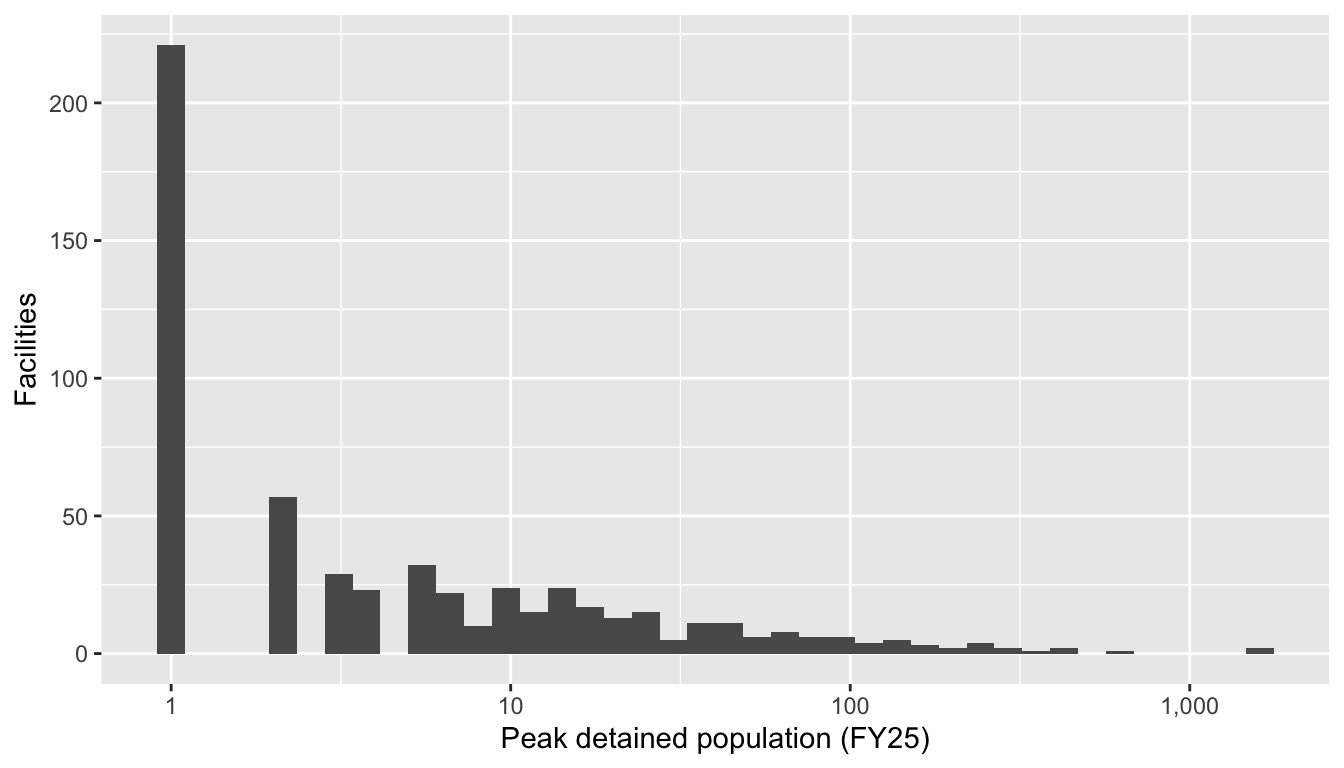
map_data <- peak_fy25 |>
  filter(peak_pop > 0, !is.na(latitude), !is.na(longitude))

map_sf <- st_as_sf(map_data, coords = c("longitude", "latitude"), crs = 4326)

type_colors <- c(
  "Dedicated"     = "#e41a1c",
  "Non-Dedicated" = "#377eb8",
  "Federal"       = "#4daf4a",
  "Hold/Staging"  = "#ff7f00",
  "Family/Youth"  = "#984ea3",
  "Medical"       = "#a65628",
  "Other/Unknown" = "#999999",
  "Unclassified"  = "#333333"
)

map_sf$type_grouped <- factor(map_sf$type_grouped, levels = names(type_colors))
present_levels <- levels(droplevels(map_sf$type_grouped))
pal <- colorFactor(palette = type_colors[present_levels], domain = present_levels)

# sqrt scale for area-proportional circle sizing
radii <- scales::rescale(sqrt(map_sf$peak_pop), to = c(3, 20))

map_sf$peak_class <- factor(map_sf$peak_class, levels = c("Peak < 2", "Peak ≥ 2"))

leaflet(map_sf) |>
  fitBounds(lng1 = -125, lat1 = 17.5, lng2 = -65, lat2 = 49.5) |>
  addProviderTiles("CartoDB.Positron") |>

  # Layer 1: Peak < 2  (small solid points, no border)
  addCircleMarkers(
    data        = subset(map_sf, peak_class == "Peak < 2"),
    radius      = 3,                # small fixed dot
    stroke      = FALSE,            # <- no outer border
    fillColor   = ~pal(type_grouped),
    fillOpacity = 1,                # solid
    label       = ~paste0(detention_facility, " (", state, ": peak ", peak_pop, ")"),
    popup       = ~paste0(
      "<b>", detention_facility, "</b><br>",
      state, " | ", type_grouped, "<br>",
      "Peak: ", peak_pop, " (", peak_date, ")<br>",
      "Mean ADP: ", mean_pop
    ),
    group = "Peak < 2"
  ) |>

  # Layer 2: Peak ≥ 2
  addCircleMarkers(
    data        = subset(map_sf, peak_class == "Peak ≥ 2"),
    radius      = radii[map_sf$peak_class == "Peak ≥ 2"],
    color       = "black",
    weight      = 1,
    fillColor   = ~pal(type_grouped),
    fillOpacity = 0.7,
    label       = ~paste0(detention_facility, " (", state, ": peak ", peak_pop, ")"),
    popup       = ~paste0(
      "<b>", detention_facility, "</b><br>",
      state, " | ", type_grouped, "<br>",
      "Peak: ", peak_pop, " (", peak_date, ")<br>",
      "Mean ADP: ", mean_pop
    ),
    group = "Peak ≥ 2"
  ) |>

  # Keep your facility-type legend
  addLegend(
    pal = pal, values = ~type_grouped,
    title = "Facility type", position = "bottomright"
  ) |>

  # Add the layer toggle
  addLayersControl(
    overlayGroups = c("Peak < 2", "Peak ≥ 2"),
    options = layersControlOptions(collapsed = FALSE)
  ) |>
  addSearchFeatures(
    targetGroups = c("Peak < 2", "Peak ≥ 2"),
    options = searchFeaturesOptions(
      zoom = 9,
      openPopup = TRUE,
      position = "topleft",
      hideMarkerOnCollapse = TRUE
    )) |>
  addControl(
    position = "bottomright",
    html = htmltools::tags$style(htmltools::HTML("
      /* Force legend text left in Quarto/Bootstrap contexts */
      .leaflet-container .leaflet-control {
        text-align: left !important;
      }
      .leaflet-container .leaflet-control .legend {
        text-align: left !important;
      }

      /* Make the color swatch and label behave like a left-aligned row */
      .leaflet-container .leaflet-control .legend i {
        display: inline-block !important;
        width: 14px !important;
        height: 14px !important;
        margin: 0 8px 0 0 !important;
        vertical-align: middle !important;
      }
      .leaflet-container .leaflet-control .legend span {
        display: inline !important;
        vertical-align: middle !important;
      }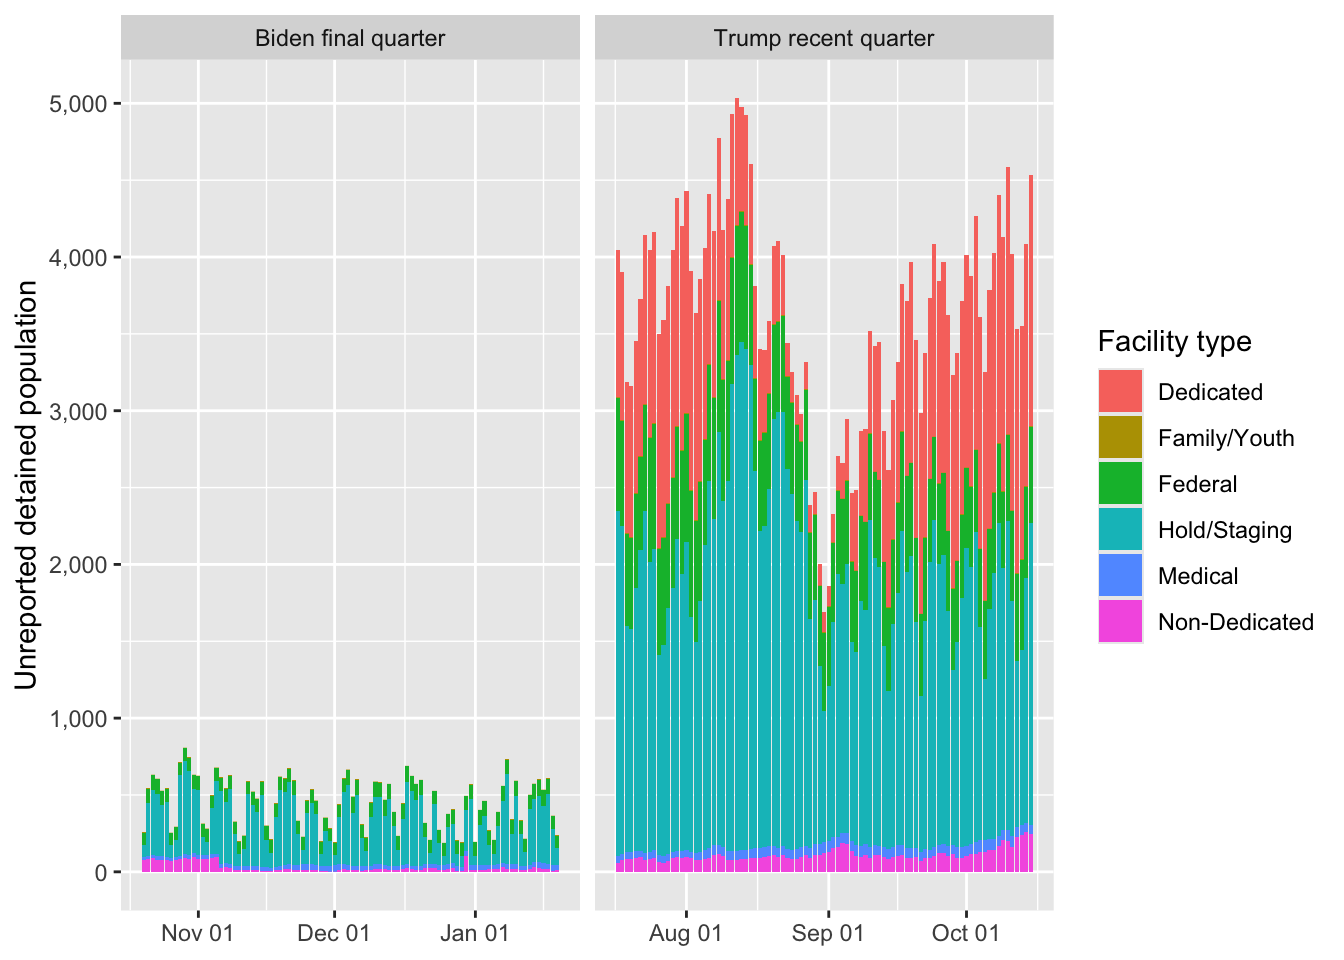
")))The preceding sections establish which DDP facilities are absent from the ICE FY25 annual statistics. Here we compare the unreported population—detainees held at those unmatched facilities—during the final three months of the Biden administration versus a comparable window under the Trump administration.
biden_from <- as.Date("2024-10-20")
biden_to   <- as.Date("2025-01-19")
trump_from <- as.Date("2025-07-01")
trump_to <- as.Date("2025-09-30")bind_rows(biden_unmatched, trump_unmatched) |>
filter(peak_pop > 0) |>
group_by(period, peak_class) |>
summarise(
Facilities = n(),
`Total ADP` = round(sum(mean_pop)),
.groups = "drop"
) |>
arrange(peak_class, period) |>
kable()| period | peak_class | Facilities | Total ADP |
|---|---|---|---|
| Biden | Peak < 2 | 109 | 8 |
| Trump | Peak < 2 | 129 | 14 |
| Biden | Peak ≥ 2 | 206 | 396 |
| Trump | Peak ≥ 2 | 292 | 3233 |
bind_rows(biden_unmatched, trump_unmatched) |>
  filter(peak_pop > 0, peak_class == "Peak \u2265 2") |>
  group_by(period) |>
  summarise(
    Facilities = n(),
    `Total ADP` = round(sum(mean_pop)),
    `Mean ADP per facility` = round(sum(mean_pop) / n(), 1),
    .groups = "drop"
  ) |>
kable()| period | Facilities | Total ADP | Mean ADP per facility |
|---|---|---|---|
| Biden | 206 | 396 | 1.9 |
| Trump | 292 | 3233 | 11.1 |
This graph shows the distribution of population totals among the unmatched facilities in each period, with a horizontal line marking the average for each period. The six largest facilities are named. As you can see, the largest unreported opulation in the Biden period would not even be an outlier in the Trump period. Conversely, the three largest unreported facilities in the Trump period each held more people in this period that all the Biden facilities combined.
source("violin-plot.R")
violin_plot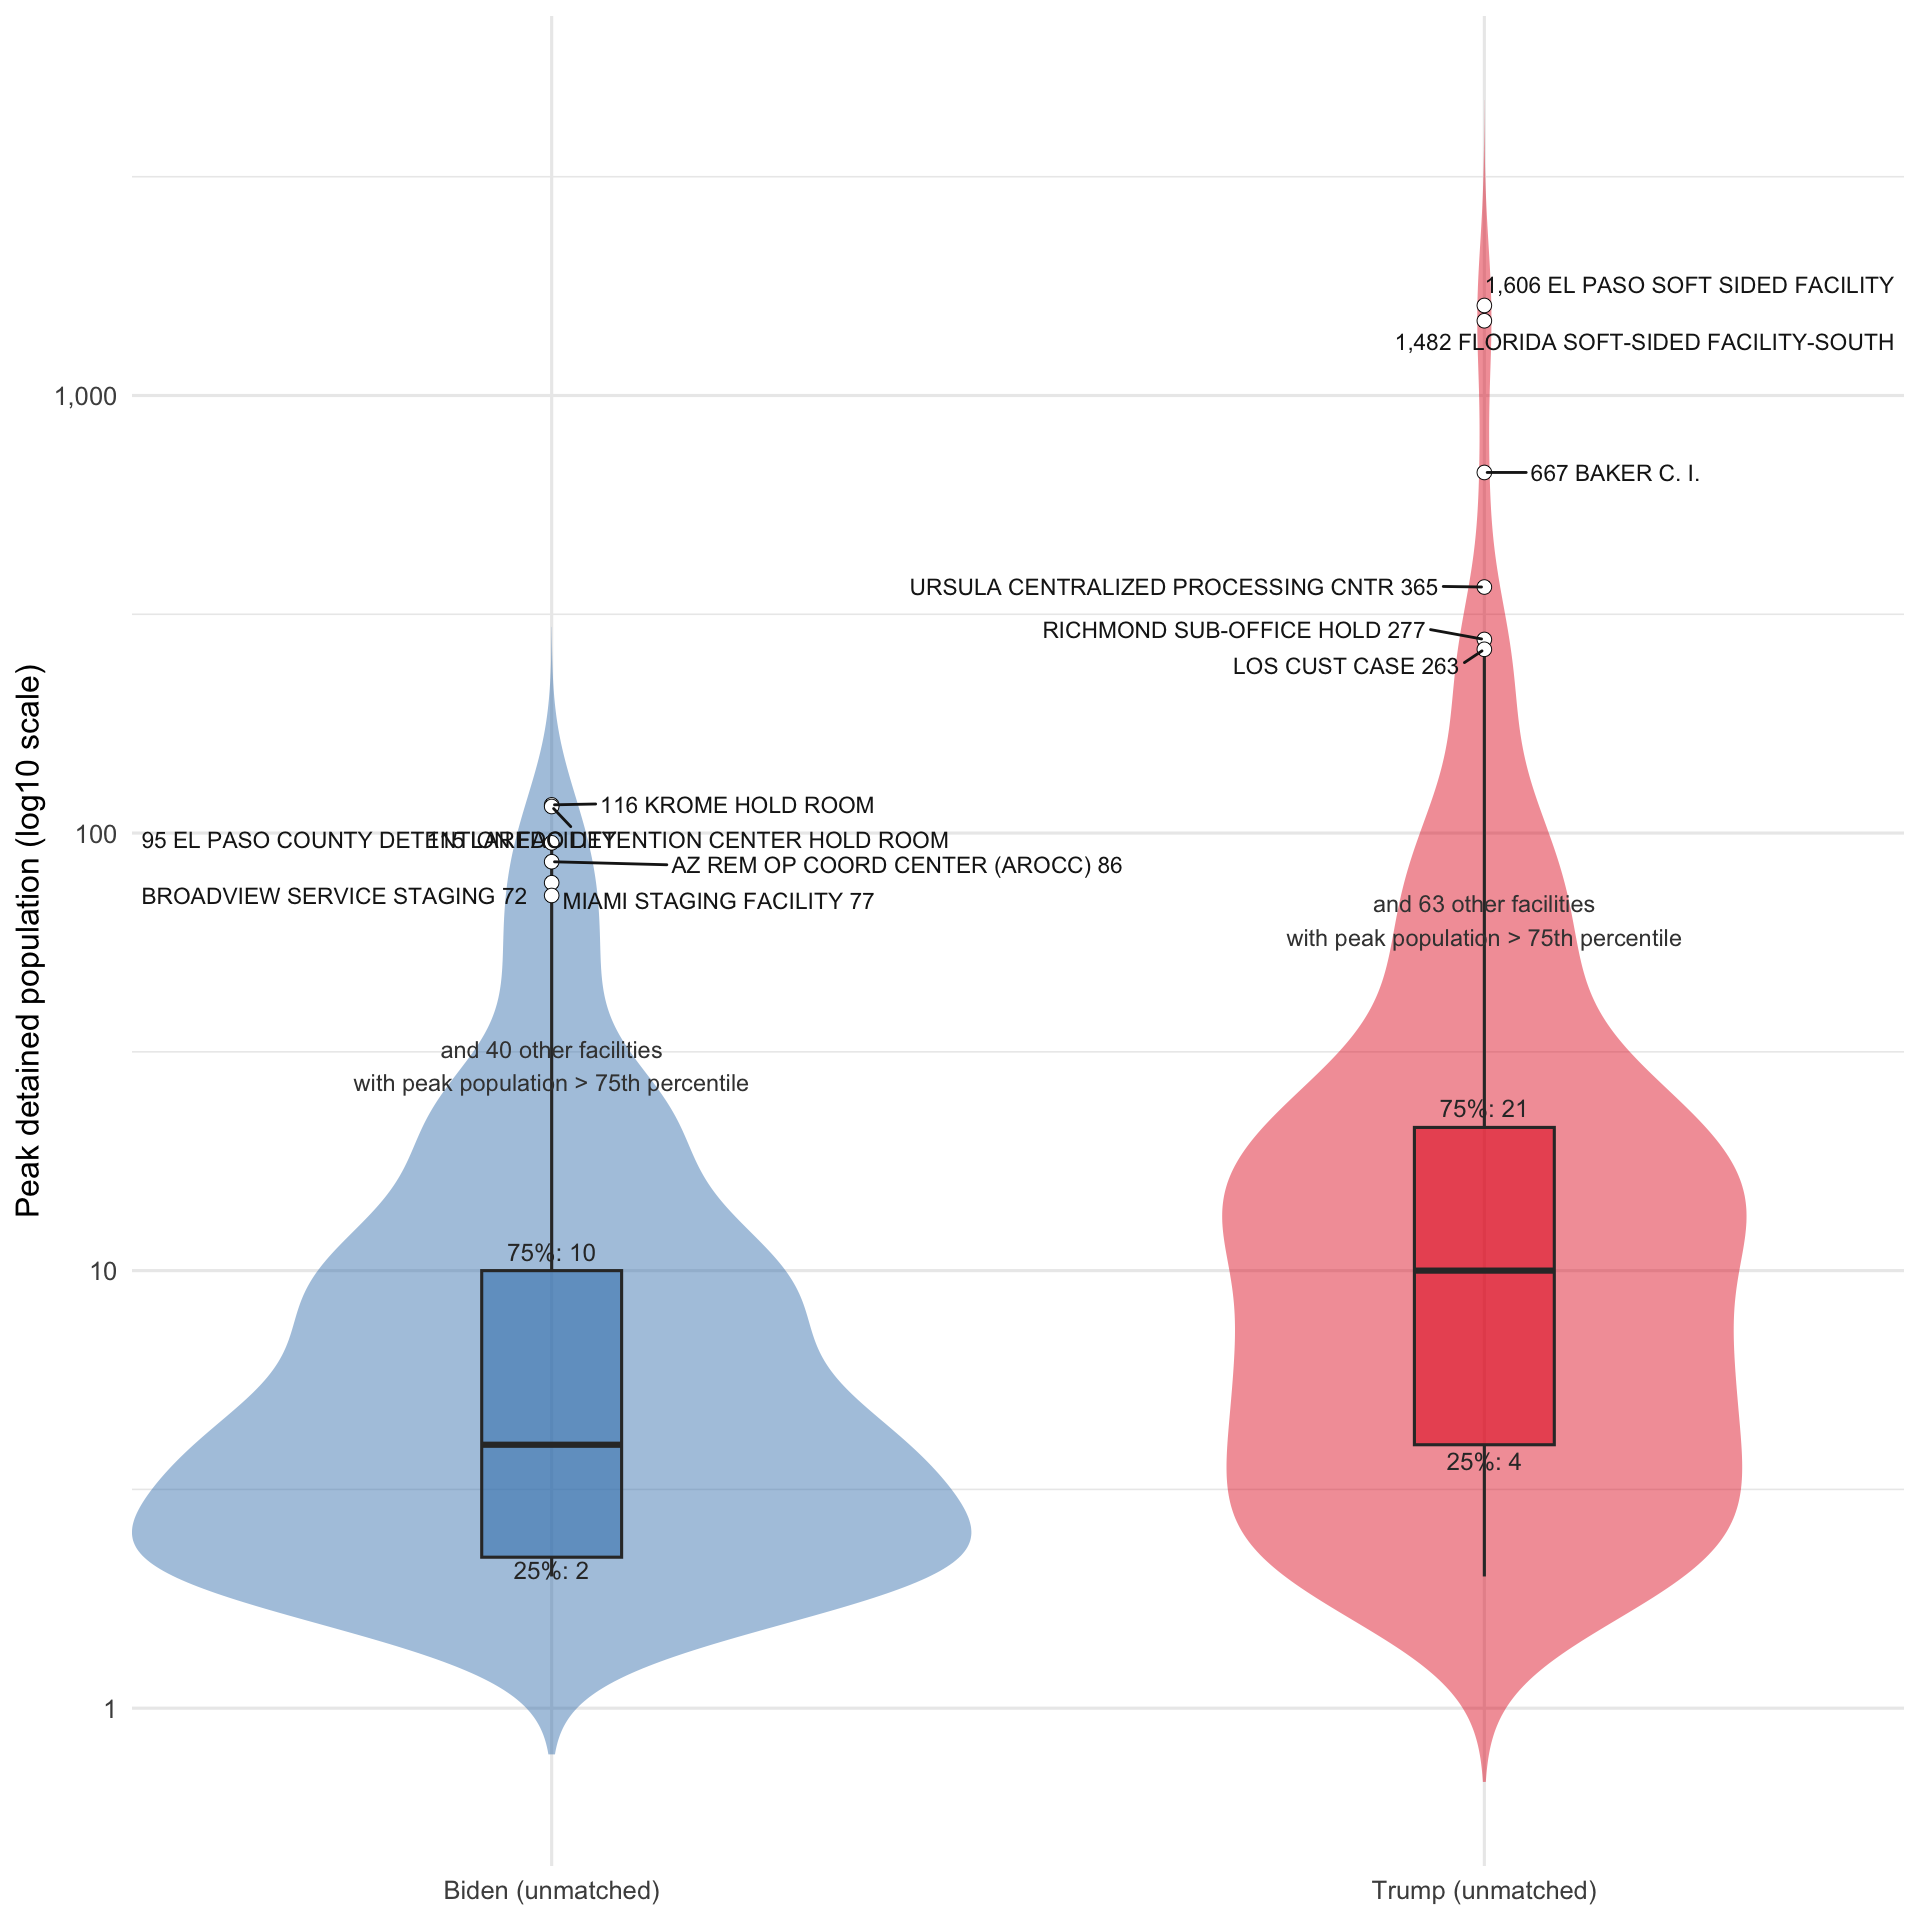
type_comp <- bind_rows(biden_unmatched, trump_unmatched) |>
  filter(peak_pop > 0, adp_class == "ADP \u2265 2") |>
  group_by(period, type_grouped) |>
  summarise(
    Facilities = n(),
    ADP = round(sum(mean_pop)),
    .groups = "drop"
  )

type_comp |>
  pivot_wider(names_from = period,
              values_from = c(Facilities, ADP),
              values_fill = 0,
              names_glue = "{period} {.value}") |>
  mutate(
    `ADP change` = `Trump ADP` - `Biden ADP`,
    `% change` = if_else(
      `Biden ADP` == 0, NA_real_,
      round((`Trump ADP` / `Biden ADP` - 1) * 100, 1)
    )
  ) |>
  arrange(desc(`Trump ADP`)) |>
  kable(col.names = c("Facility type",
                       "Biden fac.", "Trump fac.",
                       "Biden ADP", "Trump ADP",
"ADP change", "% change"))| Facility type | Biden fac. | Trump fac. | Biden ADP | Trump ADP | ADP change | % change |
|---|---|---|---|---|---|---|
| Hold/Staging | 37 | 91 | 258 | 1848 | 1590 | 616.3 |
| Dedicated | 0 | 1 | 0 | 808 | 808 | NA |
| Unclassified | 8 | 20 | 32 | 348 | 316 | 987.5 |
| Federal | 1 | 11 | 7 | 71 | 64 | 914.3 |
| Non-Dedicated | 2 | 10 | 14 | 48 | 34 | 242.9 |
bind_rows(biden_unmatched, trump_unmatched) |>
  filter(peak_pop > 0, peak_class == "Peak < 2") |>
  group_by(period, type_grouped) |>
  summarise(
    Facilities = n(),
    ADP = round(sum(mean_pop), 1),
    .groups = "drop"
  ) |>
  pivot_wider(names_from = period,
              values_from = c(Facilities, ADP),
              values_fill = 0,
              names_glue = "{period} {.value}") |>
  arrange(desc(`Trump Facilities`)) |>
  kable(col.names = c("Facility type",
                       "Biden fac.", "Trump fac.",
"Biden ADP", "Trump ADP"))| Facility type | Biden fac. | Trump fac. | Biden ADP | Trump ADP |
|---|---|---|---|---|
| Unclassified | 77 | 105 | 5.4 | 11.6 |
| Federal | 4 | 9 | 0.2 | 0.3 |
| Non-Dedicated | 9 | 8 | 1.3 | 2.1 |
| Hold/Staging | 17 | 5 | 0.5 | 0.2 |
| Medical | 2 | 1 | 0.1 | 0.1 |
| Family/Youth | 0 | 1 | 0.0 | 0.0 |
biden_active <- biden_unmatched |> filter(peak_pop > 0, peak_class == "Peak \u2265 2")
trump_active <- trump_unmatched |> filter(peak_pop > 0, peak_class == "Peak \u2265 2")

biden_only_codes <- setdiff(biden_active$detention_facility_code,
                             trump_active$detention_facility_code)
trump_only_codes <- setdiff(trump_active$detention_facility_code,
biden_active$detention_facility_code)if (length(biden_only_codes) > 0) {
biden_unmatched |>
filter(detention_facility_code %in% biden_only_codes) |>
arrange(desc(mean_pop)) |>
select(detention_facility, state, type_grouped, mean_pop, peak_pop) |>
mutate(mean_pop = round(mean_pop, 1)) |>
kable(col.names = c("Facility", "State", "Type", "Biden ADP", "Biden peak"))
}| Facility | State | Type | Biden ADP | Biden peak |
|---|---|---|---|---|
| NYE COUNTY SHERIFF-PAHRUMP | NV | Non-Dedicated | 12.0 | 69 |
| GUAYNABO MDC (SAN JUAN) | PR | Federal | 6.6 | 12 |
| MONTGOMERY CO MAC SIM BUTLER D.F. | AL | Federal | 0.9 | 2 |
| BRONSON METHODIST HOSPITAL | MI | Unclassified | 0.8 | 2 |
| COBB CO SHERIFFS OFC ADULT DET CTR | GA | Non-Dedicated | 0.6 | 4 |
| SAINT ALBANS HOLD ROOM | VT | Hold/Staging | 0.5 | 7 |
| LINCOLN COUNTY SHERIFF’S | MO | Non-Dedicated | 0.4 | 3 |
| ST. JOHN’S COUNTY JAIL | FL | Unclassified | 0.4 | 2 |
| METHODIST HOSPITAL TEXSAN | TX | Unclassified | 0.4 | 2 |
| WASHINGTON COUNTY JAIL | MN | Unclassified | 0.4 | 3 |
| ORANGE REGIONAL MED CTR | NY | Unclassified | 0.2 | 2 |
| LOMPOC FCI | CA | Unclassified | 0.2 | 6 |
| COLUMBUS HOLDROOM | OH | Hold/Staging | 0.2 | 9 |
| KARNES COUNTY CIVIL DET. FACILITY | TX | Family/Youth | 0.1 | 2 |
| KINNEY COUNTY JAIL | TX | Unclassified | 0.1 | 4 |
| SIOUX CITY HOLD ROOM | IA | Hold/Staging | 0.1 | 3 |
| EL CENTRO REGIONAL MED CTR | CA | Unclassified | 0.1 | 2 |
| METHODIST HOSPITAL | TX | Unclassified | 0.1 | 2 |
| SPRINGFIELD FED.MED.CNTR | MO | Unclassified | 0.1 | 2 |
| FCI VICTORVILLE | CA | Unclassified | 0.1 | 7 |
| ST FRANCIS HOSPITAL | GA | Unclassified | 0.1 | 2 |
| CHANDLER REG MED CTR | AZ | Unclassified | 0.1 | 2 |
| CINCINNATI HOLDROOM | OH | Hold/Staging | 0.0 | 2 |
| SNJ HOLD ROOM | CA | Hold/Staging | 0.0 | 2 |
24 unreported facilities (Peak ≥ 2) were active in the Biden period but fell below the threshold or had zero population in the Trump period. Of these, 2 had ADP ≥ 2 under Biden, contributing 19 ADP in total.
if (length(trump_only_codes) > 0) {
  trump_unmatched |>
    filter(detention_facility_code %in% trump_only_codes) |>
    arrange(desc(mean_pop)) |>
    select(detention_facility, state, type_grouped, mean_pop, peak_pop) |>
    mutate(mean_pop = round(mean_pop, 1)) |>
    kable(col.names = c("Facility", "State", "Type", "Trump ADP", "Trump peak")) |>
    scroll_box(height = "630px")
}| Facility | State | Type | Trump ADP | Trump peak |
|---|---|---|---|---|
| FLORIDA SOFT-SIDED FACILITY-SOUTH | FL | Dedicated | 808.4 | 1482 |
| EL PASO SOFT SIDED FACILITY | TX | Hold/Staging | 326.1 | 1606 |
| BAKER C. I. | FL | Unclassified | 176.1 | 667 |
| URSULA CENTRALIZED PROCESSING CNTR | TX | Unclassified | 84.6 | 365 |
| BROOKS COUNTY JAIL (CONTRACT) | TX | Federal | 21.1 | 90 |
| TURNER GUIFORD KNIGHT (TGK) JAIL | FL | Non-Dedicated | 14.9 | 27 |
| WESTERN TENNESSEE DET. FAC. | TN | Federal | 12.6 | 74 |
| MARTIN COUNTY JAIL | FL | Non-Dedicated | 7.4 | 24 |
| CHRISTIAN COUNTY JAIL | KY | Federal | 6.4 | 51 |
| WESTMINSTER CUSTODY | CA | Hold/Staging | 6.0 | 7 |
| RIO VISTA BEHV HLTH HSP | TX | Unclassified | 5.2 | 14 |
| ERO HOLD ROOM (SPRINGFIELD MO) | MO | Hold/Staging | 5.0 | 62 |
| OSCEOLA COUNTY JAIL | FL | Unclassified | 4.5 | 12 |
| EASTERN REGIONAL JAIL | WV | Federal | 4.5 | 23 |
| SW VIRGINIA REG JAIL AUTH-ABG FAC | VA | Unclassified | 4.0 | 47 |
| SIOUX COUNTY JAIL | IA | Federal | 4.0 | 11 |
| CHAVEZ DET CRT | NM | Non-Dedicated | 3.5 | 16 |
| TOM GREEN CTY JAIL | TX | Federal | 3.2 | 11 |
| LAWRENCE CO. JAIL, SD | SD | Non-Dedicated | 2.7 | 11 |
| GRAND RAPIDS HOLDROOM | MI | Hold/Staging | 2.7 | 9 |
| NEW YORK PRESBYTERIAN HOSPITAL | NY | Unclassified | 2.4 | 5 |
| CHESAPEAKE CITY JAIL | VA | Unclassified | 2.3 | 25 |
| CEDAR RAPIDS HOLD ROOM | IA | Hold/Staging | 2.2 | 17 |
| CASCADE COUNTY JAIL, MT | MT | Federal | 2.1 | 5 |
| HILLSBOROUGH COUNTY JAIL | FL | Non-Dedicated | 2.0 | 12 |
| WHITE MEMORIAL HOSPITAL | CA | Unclassified | 1.8 | 4 |
| SCOTT COUNTY JAIL | IA | Unclassified | 1.8 | 7 |
| SYRACUSE HOLD ROOM | NY | Hold/Staging | 1.8 | 14 |
| SEMINOLE COUNTY JAIL | FL | Unclassified | 1.7 | 5 |
| CACHE CO. JAIL | UT | Federal | 1.7 | 13 |
| BUFFALO HOLD ROOM | NY | Hold/Staging | 1.7 | 17 |
| ST JOSEPH MEDICAL CENTER | WA | Unclassified | 1.7 | 4 |
| MINICASSIA DET. CENTER | ID | Non-Dedicated | 1.6 | 7 |
| LARAMIE COUNTY JAIL | WY | Federal | 1.6 | 8 |
| RIO GRANDE VALLEY STAGING | TX | Hold/Staging | 1.5 | 11 |
| MARION COUNTY JAIL | FL | Unclassified | 1.5 | 5 |
| COLO SPRINGS DEN HSI HOLD | CO | Hold/Staging | 1.5 | 9 |
| LIRS - LFSRM FORT COLLINS LTFC CO | CO | Unclassified | 1.5 | 2 |
| TEX HEALTH HUGULEY HOSP | TX | Medical | 1.3 | 4 |
| NASSAU COUNTY ICE TRAILER | NY | Unclassified | 1.3 | 13 |
| UNIVERSITY MED CENTER OF EL PASO | TX | Unclassified | 1.2 | 3 |
| BREVARD COUNTY JAIL COMPLEX | FL | Unclassified | 1.2 | 5 |
| AGUADILLA SPC | PR | Hold/Staging | 1.2 | 26 |
| EL PASO LTAC HOSPITAL | TX | Unclassified | 1.1 | 3 |
| PROMISE HOSPITAL | AZ | Unclassified | 1.1 | 3 |
| ALVARADO PARKWAY INSTITUTE | CA | Unclassified | 1.0 | 3 |
| UCHEALTH UNV HOSP OF CO | CO | Unclassified | 0.9 | 2 |
| ANAHEIM GLOBAL MEDICAL CENTER | CA | Unclassified | 0.9 | 3 |
| MANATEE COUNTY DETENTION-ANNEX | FL | Unclassified | 0.9 | 7 |
| VRK PRCS | NY | Hold/Staging | 0.9 | 12 |
| HARRIS COUNTY PSYCHIATRIC CENTER | TX | Unclassified | 0.9 | 2 |
| DADE CORRECTIONAL INST | FL | Dedicated | 0.8 | 11 |
| BUFFALO USBP HOLD ROOM | NY | Federal | 0.7 | 20 |
| POLK COUNTY JAIL | FL | Unclassified | 0.7 | 23 |
| LOUISVILLE HOLD ROOM | KY | Hold/Staging | 0.7 | 4 |
| CBP MOVEMENT COORDINATION AREA | NA | Unclassified | 0.7 | 12 |
| FRANKLIN COUNTY JAIL | PA | Federal | 0.6 | 3 |
| BROWN COUNTY JAIL | WI | Unclassified | 0.6 | 4 |
| CHAMPLAIN HOLD ROOM | NY | Hold/Staging | 0.5 | 8 |
| HOUSTON HEALTHCARE HOSP | TX | Unclassified | 0.5 | 3 |
| LOUDOUN COUNTY | VA | Unclassified | 0.5 | 4 |
| NORTHWEST REG. ADULT DET. | VA | Unclassified | 0.5 | 3 |
| WENTWORTH DOUGLAS HOSPITAL | NH | Unclassified | 0.5 | 2 |
| RAPID CITY HOLD ROOM | SD | Hold/Staging | 0.5 | 7 |
| FRIO REGIONAL HOSPITAL | TX | Unclassified | 0.5 | 2 |
| CLEVELAND HOLD ROOM | OH | Hold/Staging | 0.4 | 14 |
| NASHVILLE HOLD ROOM | TN | Hold/Staging | 0.4 | 22 |
| BROWARD GENERAL MEDICAL CENTER | FL | Unclassified | 0.4 | 3 |
| UNION COUNTY JAIL | SD | Unclassified | 0.4 | 9 |
| GLENWOOD SPRINGS HOLDROOM | CO | Hold/Staging | 0.4 | 3 |
| MEDFORD SUB-OFFICE | OR | Hold/Staging | 0.4 | 14 |
| UNIVERSITY HOSPITAL | NJ | Unclassified | 0.4 | 2 |
| ALAMOSA HOLDROOM | CO | Hold/Staging | 0.4 | 7 |
| EUGENE HOLDROOM | OR | Hold/Staging | 0.4 | 7 |
| MONROE COUNTY JAIL | FL | Non-Dedicated | 0.4 | 2 |
| LOYOLA CENTER FOR HEALTH | IL | Unclassified | 0.4 | 6 |
| TX HLTH HARRIS METH HOSP | TX | Unclassified | 0.4 | 2 |
| LAREDO MEDICAL CENTER | TX | Unclassified | 0.3 | 2 |
| NASSAU UNIV MED CTR | NY | Unclassified | 0.3 | 3 |
| GRADY MEMORIAL HOSPITAL | GA | Unclassified | 0.3 | 2 |
| HIGHLAND MTN COR CTR | AK | Unclassified | 0.3 | 2 |
| DURANGO HOLDROOM | CO | Hold/Staging | 0.3 | 6 |
| ARROWHEAD REGIONAL MED CENTER | CA | Unclassified | 0.3 | 3 |
| MCLENNAN COUNTY JAIL | TX | Unclassified | 0.3 | 2 |
| BOSTON SPC | MA | Unclassified | 0.3 | 2 |
| CENTRAL VA REGIONAL JAIL | VA | Unclassified | 0.3 | 2 |
| VIRGINIA BEACH | VA | Unclassified | 0.3 | 2 |
| CAMPBELL COUNTY JAIL | WY | Unclassified | 0.3 | 4 |
| FLAGLER COUNTY JAIL | FL | Unclassified | 0.3 | 12 |
| SUMTER COUNTY JAIL | FL | Unclassified | 0.3 | 2 |
| BANNER IRONWOOD MED CTR | AZ | Unclassified | 0.2 | 2 |
| CRAIG HOLDROOM | CO | Hold/Staging | 0.2 | 4 |
| PARKLAND HOSPITAL | TX | Unclassified | 0.2 | 3 |
| WEST MIAMI DADE BAPT HEALTH EMERG | FL | Unclassified | 0.2 | 2 |
| SALINE COUNTY JAIL | NE | Non-Dedicated | 0.2 | 7 |
| ST ELIZABETH YOUNGSTOWN HOSPITAL | OH | Unclassified | 0.2 | 2 |
| UNIVERSITY MEDICAL CENTER | NV | Unclassified | 0.2 | 2 |
| CHARLESTON COUNTY CORRECT | SC | Federal | 0.1 | 3 |
| EL PASO COUNTY JAIL (TX) | TX | Unclassified | 0.1 | 2 |
| PALM BEACH COUNTY JAIL | FL | Unclassified | 0.1 | 4 |
| MOUNT NITTANY MEDICAL CENTER | PA | Unclassified | 0.1 | 2 |
| RIO GRANDE ST.HOSPITAL | TX | Unclassified | 0.1 | 7 |
| CHARLOTTE COUNTY JAIL | FL | Unclassified | 0.1 | 2 |
| ANCHORAGE SUB-OFFICE HOLD ROOM | AK | Hold/Staging | 0.1 | 5 |
| GARDEN CITY PROCESSING @ FINNEY CO | KS | Unclassified | 0.1 | 3 |
| HEL DISTRICT CUSTODY | MT | Hold/Staging | 0.1 | 2 |
| FORT SMITH HOLDROOM | AR | Hold/Staging | 0.0 | 3 |
| HENDERSONVILLE HOLD ROOM | NC | Hold/Staging | 0.0 | 3 |
| WICHITA HOLDROOM | KS | Hold/Staging | 0.0 | 2 |
| MARION CO JAIL | OR | Unclassified | 0.0 | 2 |
110 unreported facilities (Peak ≥ 2) were active in the Trump period but not the Biden period. Of these, 25 had ADP < 2 under Trump, contributing 1514 ADP in total.
if (length(trump_only_codes) > 0) {
  trump_unmatched |>
    filter(detention_facility_code %in% trump_only_codes) |>
    group_by(type_grouped) |>
    summarise(
      Facilities = n(),
      `Total ADP` = round(sum(mean_pop)),
      .groups = "drop"
    ) |>
    arrange(desc(`Total ADP`)) |>
    kable(col.names = c("Facility type", "Facilities", "Total ADP"))
}| Facility type | Facilities | Total ADP |
|---|---|---|
| Dedicated | 2 | 809 |
| Hold/Staging | 27 | 355 |
| Unclassified | 60 | 311 |
| Federal | 12 | 59 |
| Non-Dedicated | 8 | 33 |
| Medical | 1 | 1 |
both_codes <- intersect(biden_active$detention_facility_code,
                         trump_active$detention_facility_code)

both_compare <- biden_unmatched |>
  filter(detention_facility_code %in% both_codes) |>
  select(detention_facility_code, detention_facility, state, type_grouped,
         biden_adp = mean_pop, biden_peak = peak_pop) |>
  inner_join(
    trump_unmatched |>
      filter(detention_facility_code %in% both_codes) |>
      select(detention_facility_code,
             trump_adp = mean_pop, trump_peak = peak_pop),
    by = "detention_facility_code"
  ) |>
  mutate(
    adp_change = trump_adp - biden_adp,
    adp_pct_change = if_else(biden_adp == 0, NA_real_,
                             (trump_adp / biden_adp - 1) * 100)
)ggplot(both_compare, aes(x = biden_adp, y = trump_adp, color = type_grouped)) +
geom_abline(slope = 1, intercept = 0, linetype = "dashed", alpha = 0.5) +
geom_point(alpha = 0.7) +
scale_x_log10(labels = comma) +
scale_y_log10(labels = comma) +
labs(x = "Biden final quarter ADP", y = "Trump recent quarter ADP",
color = "Facility type")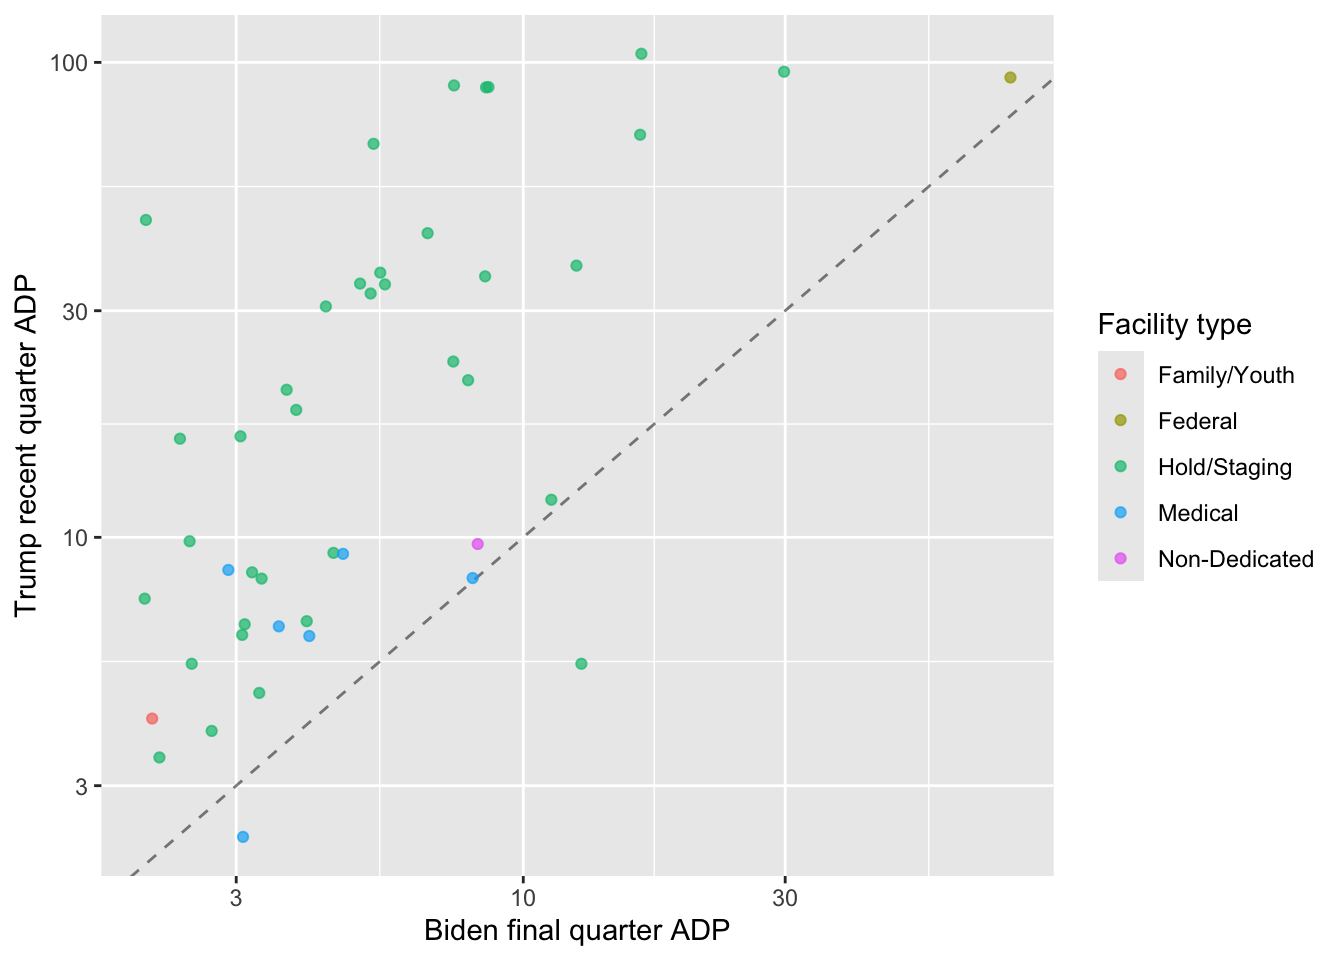
both_compare |>
  arrange(desc(adp_change)) |>
  head(15) |>
  transmute(
    Facility = detention_facility, State = state, Type = type_grouped,
    `Biden ADP` = round(biden_adp),
    `Trump ADP` = round(trump_adp),
    Change = round(adp_change)
  ) |>
kable()| Facility | State | Type | Biden ADP | Trump ADP | Change |
|---|---|---|---|---|---|
| DALLAS F.O. HOLD | TX | Hold/Staging | 16 | 104 | 88 |
| LOS CUST CASE | CA | Hold/Staging | 7 | 89 | 82 |
| ATLANTA DIST. HOLD RM | GA | Hold/Staging | 9 | 89 | 80 |
| BROADVIEW SERVICE STAGING | IL | Hold/Staging | 9 | 89 | 80 |
| MONTGOMERY HOLD RM | TX | Hold/Staging | 30 | 96 | 66 |
| NYC HOLD ROOM | NY | Hold/Staging | 5 | 67 | 62 |
| AZ REM OP COORD CENTER (AROCC) | AZ | Hold/Staging | 16 | 70 | 54 |
| BALTIMORE HOLD ROOM | MD | Hold/Staging | 2 | 47 | 45 |
| WASHINGTON FIELD OFFICE | VA | Hold/Staging | 7 | 44 | 37 |
| MIAMI (MIRAMAR) HOLD ROOM | FL | Hold/Staging | 0 | 35 | 35 |
| SAN ANTONIO DRO HOLD ROOM | TX | Hold/Staging | 5 | 36 | 31 |
| RICHMOND SUB-OFFICE HOLD | VA | Hold/Staging | 5 | 34 | 29 |
| ORLANDO HOLD ROOM | FL | Hold/Staging | 6 | 34 | 28 |
| TAMPA HOLD ROOM | FL | Hold/Staging | 5 | 33 | 27 |
| SND DISTRICT STAGING | CA | Hold/Staging | 9 | 35 | 27 |
both_compare |>
  arrange(adp_change) |>
  head(15) |>
  transmute(
    Facility = detention_facility, State = state, Type = type_grouped,
    `Biden ADP` = round(biden_adp),
    `Trump ADP` = round(trump_adp),
    Change = round(adp_change)
  ) |>
kable()| Facility | State | Type | Biden ADP | Trump ADP | Change |
|---|---|---|---|---|---|
| KROME HOLD ROOM | FL | Hold/Staging | 21 | 0 | -21 |
| MCALLEN HOLD ROOM | TX | Hold/Staging | 13 | 5 | -7 |
| PECOS HOLD ROOM | TX | Hold/Staging | 3 | 1 | -1 |
| COLUMBIA CARE CENTER | SC | Unclassified | 3 | 2 | -1 |
| NEW/INS OS HOLD ROOM | NJ | Hold/Staging | 1 | 0 | -1 |
| CASPER HOLDROOM | WY | Hold/Staging | 0 | 0 | 0 |
| CHARLOTTE AMALIE HOLDROOM | VI | Hold/Staging | 0 | 0 | 0 |
| BALDWIN COUNTY COR. CENTER | AL | Non-Dedicated | 2 | 2 | 0 |
| FAYETTEVILLE HOLD ROOM | AR | Hold/Staging | 0 | 0 | 0 |
| LAS CRUCES HOLD ROOM | NM | Hold/Staging | 0 | 0 | 0 |
| JACK HARWELL DETENTION CENTER | TX | Federal | 0 | 0 | 0 |
| VALLEYWISE HEALTH MED CTR | AZ | Unclassified | 0 | 0 | 0 |
| LEXINGTON PROCESSING @ FAYETTE CO | KY | Unclassified | 0 | 0 | 0 |
| ROCK ISLAND HOLD ROOM | IL | Hold/Staging | 1 | 1 | 0 |
| TITUS COUNTY JAIL | TX | Federal | 0 | 0 | 0 |
ggplot(daily_unreported, aes(x = date, y = total_pop, fill = type_grouped)) +
  geom_col() +
  facet_wrap(~period, scales = "free_x") +
  scale_y_continuous(labels = comma) +
  scale_x_date(date_labels = "%b %d") +
  labs(x = NULL, y = "Unreported detained population", fill = "Facility type")