-
This Sunday, the Federal government found that Nashville is "in the Red Zone" for COVID spread, at the very same time Nashville's own metrics turned from red to yellow and green. Here's why… @VanderbiltAAUP/1288183007195660296Permalink On twitter.com

 Mood 0
-
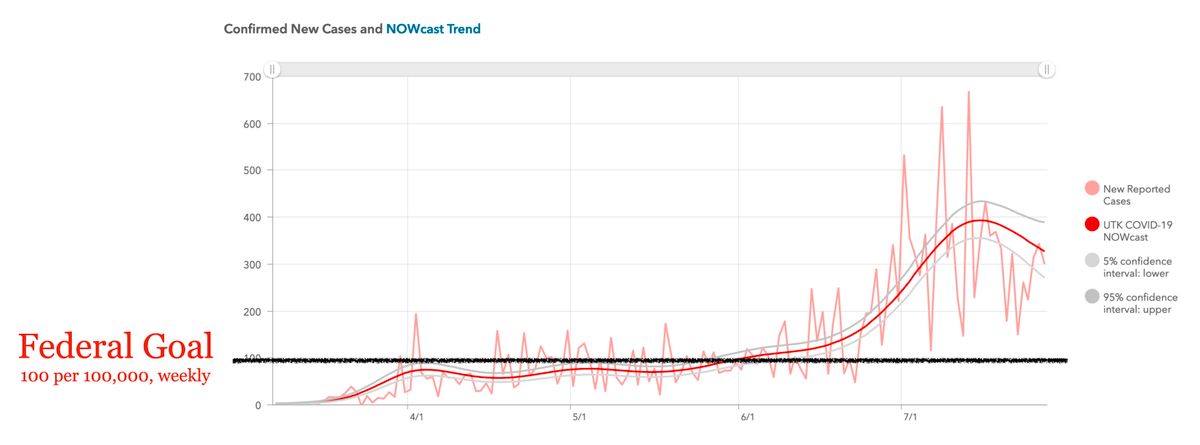
Federal metrics, like those of the Harvard Global Health Initiative, California, and the many countries that are beating this pandemic are about number of cases per population. The Federal goal is <100 per 100,000 people.Permalink On twitter.com
Mood +1 🙂
-
Translated into local terms, that's 99 cases per day. Nashville hasn't been at that level since early June.Permalink On twitter.com
 Mood 0
-
Goal might be too kind of a word. This is the limit of what the Federal covid team calls the "red zone" or "yellow zone" depending on whether the testing positivity is over 10% or not.Permalink On twitter.com
 Mood +2 🙂
-
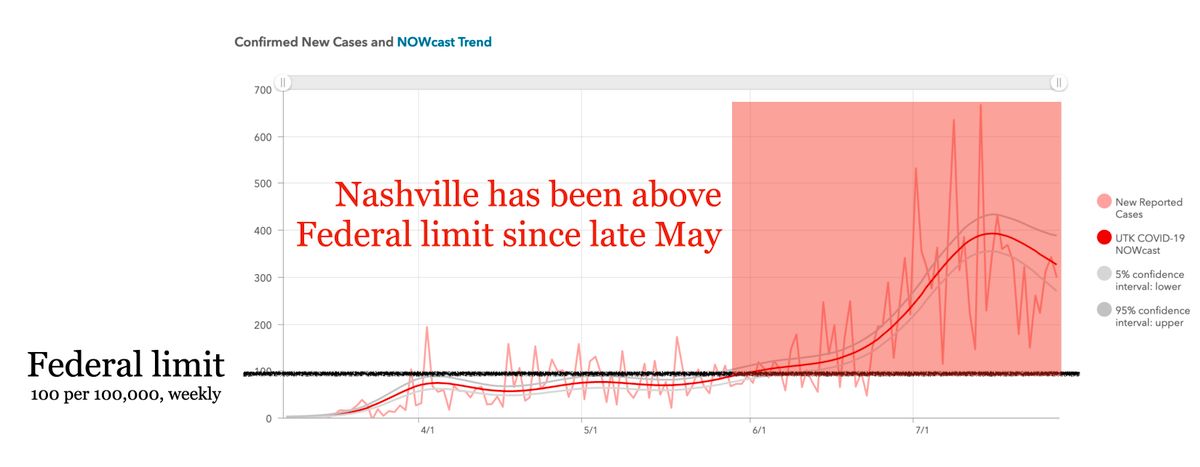
The Federal government has been talking about this behind closed doors. (Thanks, Trump!) But Nashville has been above this Federal limit since late May.Permalink On twitter.com
Mood +2 🙂
-
And the positivity rate (share of tests coming back positive for COVID) has been over 10% since mid-June. The idea is if this number is this high, many infected people aren't getting tested, so we must assume community infection rates are higher than they appear.Permalink On twitter.com
Mood -1 🙁
-
Add the two standards and Nashville has been in the Red Zone since mid-June.Permalink On twitter.com
Mood 0
-
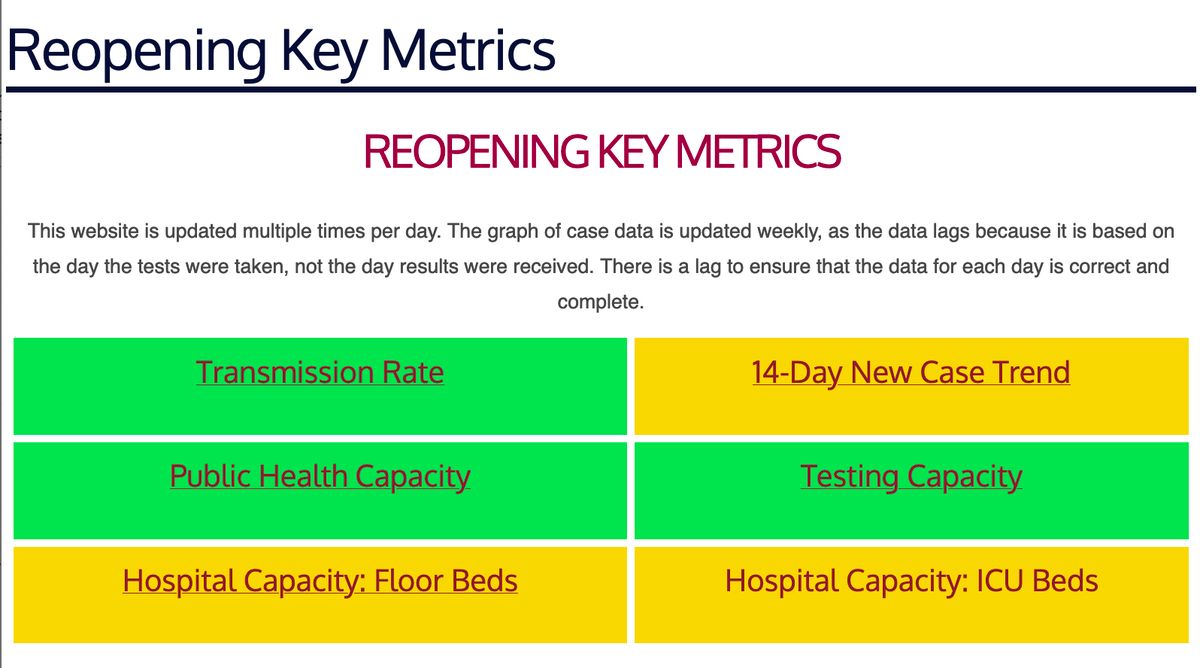
But here's the city's metric board TODAY: 3 Green, 3 Yellow. Why? Read on.Permalink On twitter.com
 Mood 0
-
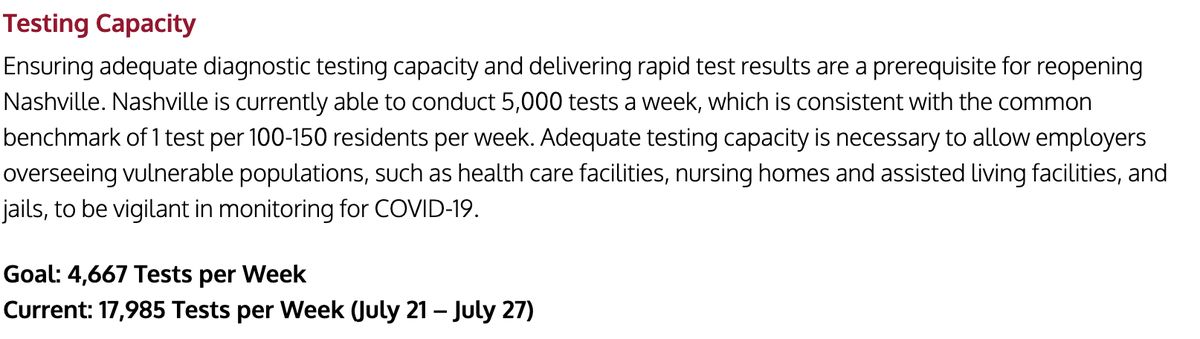
First, testing capacity: The city's only question: is there at least one test per 100-150 residents. But now, at least 1 in 100 Nashvillian is known to be infected and several times more than that are likely infected too. This standard needs to be updated.Permalink On twitter.com
 Mood -4 🙁
-
Two metrics assess whether our hospital capacity is maxed out. This are yellow since we still have room for sick COVID patients, for now.Permalink On twitter.com
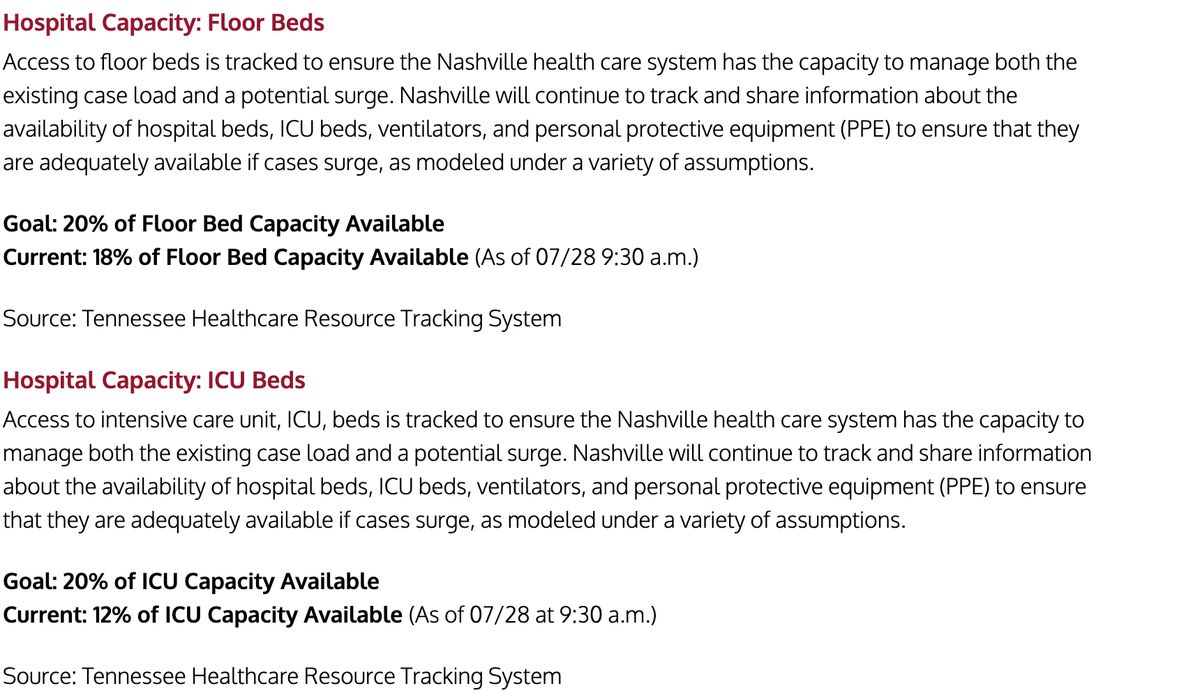 Mood -2 🙁
-
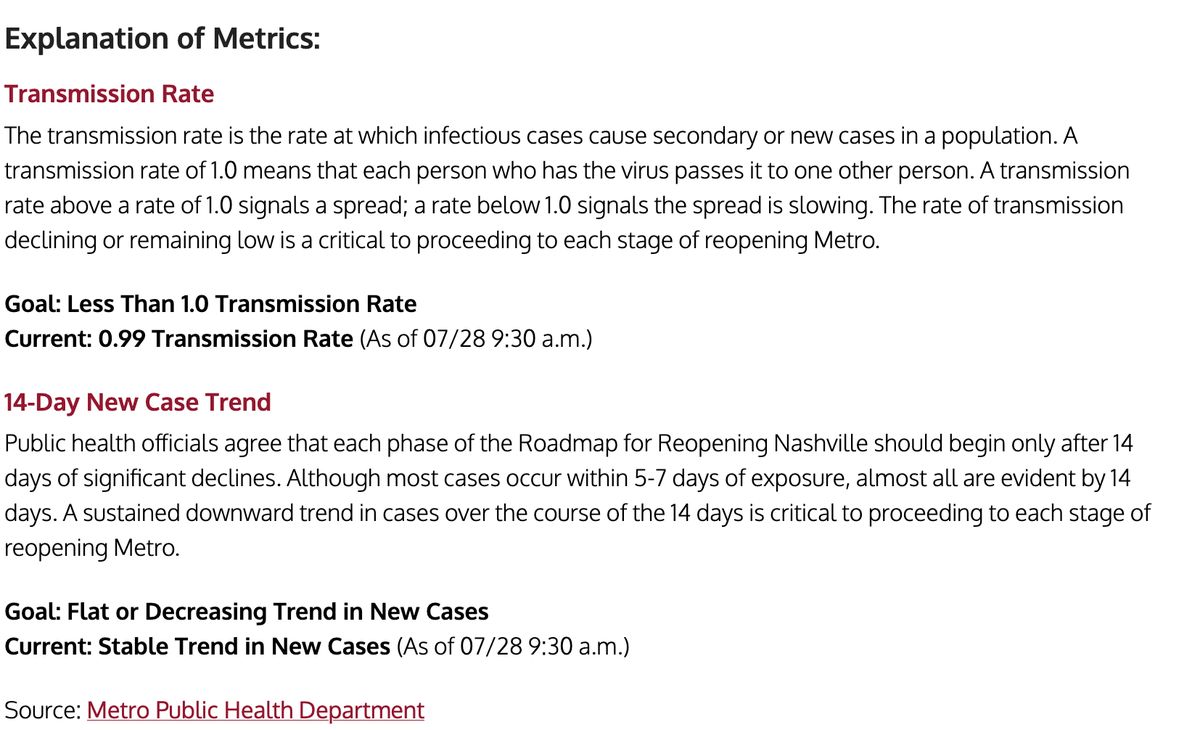
But the two main metrics are disconnected from the scale of infection in the community. They are only concerned with how that number is changing.Permalink On twitter.com
 Mood -4 🙁
-
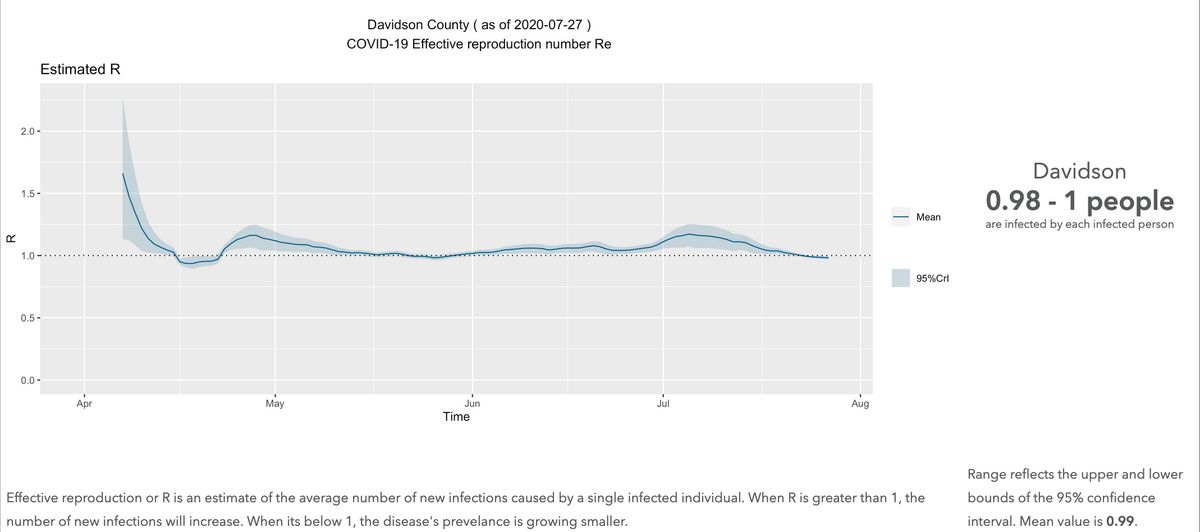
Transmission rate estimates the number of people each infected person will go on to infect. If greater than 1, the outbreak grows. If less than one, it shrinks. Right now, it's estimated at 0.99. Assuming everyone who's infected is getting tested, which they aren't.Permalink On twitter.com
Mood -5 🙁
-
For Nashville's plan, so long as that number is less than 1.00, the metric is green. Without aiming for a lower number, we ensure that the number of active infections never goes down significantly.Permalink On twitter.com
 Mood 0
-
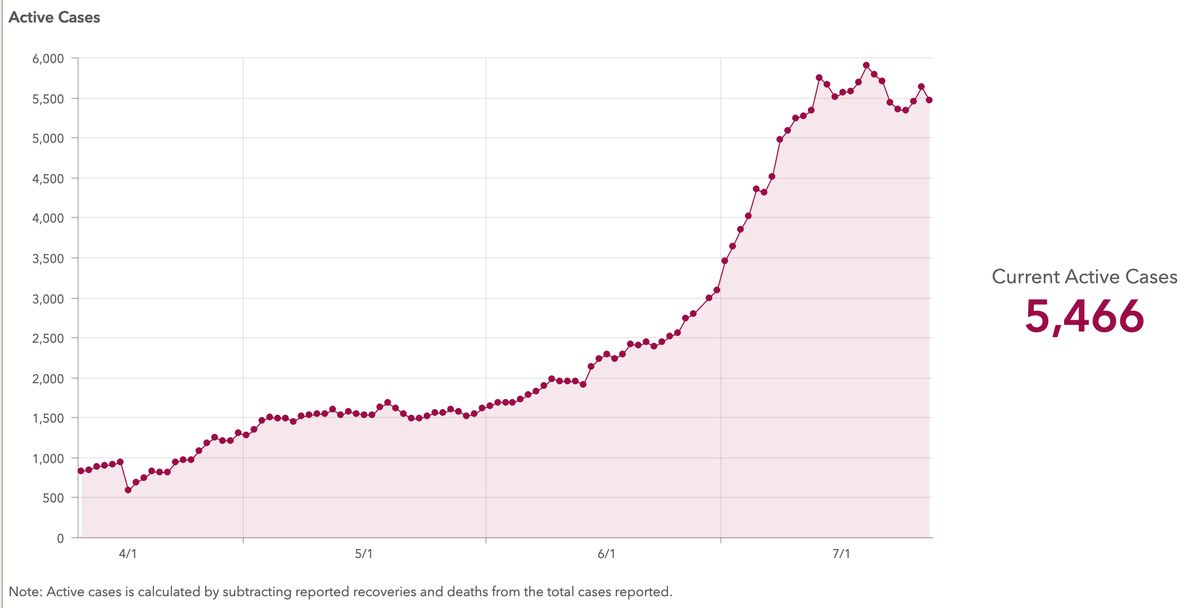
And that's just what has happened since April. Nashville's transmission rate has never risen above 1.20, but like the tortoise, the actively infected population has slowly and steadily risen from under 1,000 to over 5,000.Permalink On twitter.com
 Mood 0
-
Notice that tiny period below 1.00 back in late April. During the shutdown we got down to a transmission rate of maybe 0.95. To get back down from 5,400 active infections to 2,000, we need twenty generations of transmission, most of a year.Permalink On twitter.com
Mood -1 🙁
-
To go from our current rate of transmission back to the Federal limit, we need 25 rounds of 0.95 transmission. Or nearly a hundred rounds of 0.99 transmission.Permalink On twitter.com
Mood 0
-
That's why the Federal guidance, or the Harvard Global Health guidance, or the California state guidance all call for drastic measures when our infection rate is above the limit.On twitter.com
Mood -2 🙁
-
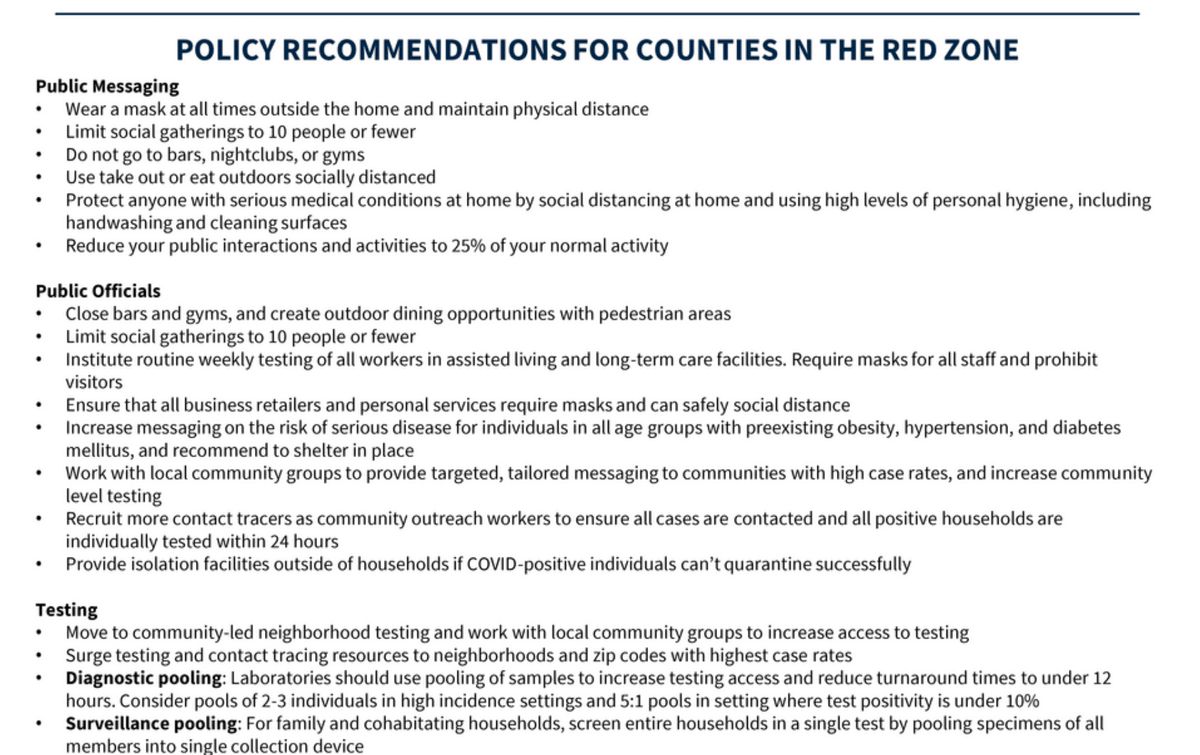
Here's what Deborah Birx and the White House are recommending for Nashville and for Tennessee: @VanderbiltAAUP/1288185175466299393Permalink On twitter.com
Mood 0
-
And the full list of recommendations. This is not subtle stuff. But now the White House Task Force is more aggressive than @JohnCooper4Nash, our New South city, and the medical experts who should have made better metrics back in April.Permalink On twitter.com
 Mood 0
-
White House Task Force recommendations from this document leaked to the New York Times: nytimes.com/interactive/2020/07/28/us/states-report-virus-response-july-26.htmlPermalink On twitter.com
Mood -1 🙁