-
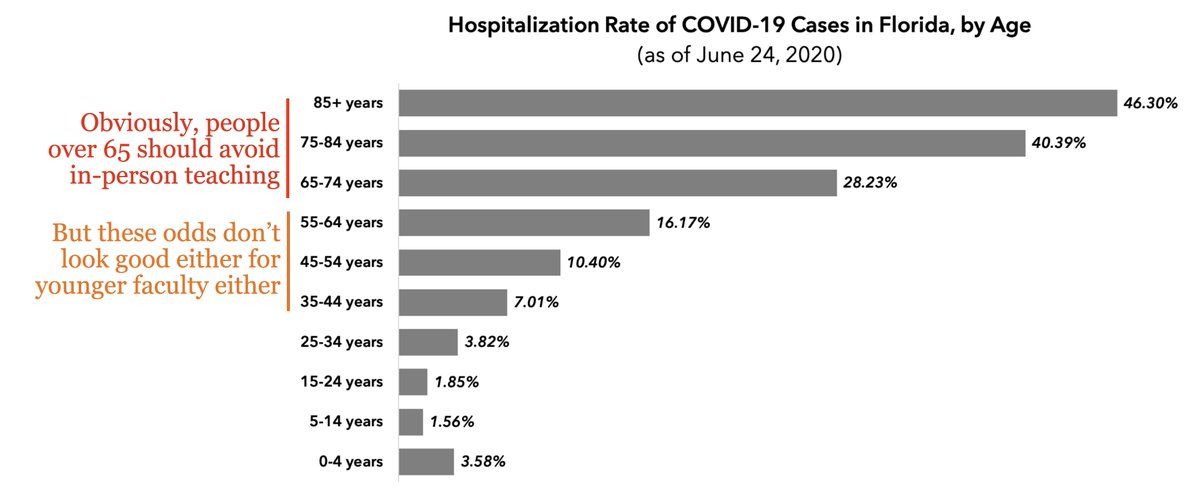
My concerns about faculty returning to on-campus teaching in one graphic. (accessible description follows)Permalink On twitter.com

 ♻️ 4 Retweets
❤️ 5 Favorites
Mood +1 🙂
♻️ 4 Retweets
❤️ 5 Favorites
Mood +1 🙂
-
Bar graph shows current "Hospitalization rates of COVID-19 Cases in Florida, by Age." That is, what percent of positively tested individuals are hospitalized. 85+: 46.30% 75-84: 40.39% 65-74: 28.23% Comment: Obviously, people over 65 should avoid in-person teachingPermalink On twitter.com
Mood -1 🙁
-
55-64: 16.17% 45-54: 10.4% 35-44: 7.01% Comment: But these odds don’t look good either for younger faculty eitherPermalink On twitter.com
❤️ 1 Favorite
Mood +3 🙂
-
25-34: 3.82% 15-24: 1.85% 5-14: 1..56% 0-4: 3.58% Comment: decisions for faculty aged 30 to 105 are being made by looking at the numbers for students aged 15 to 24.Permalink On twitter.com
❤️ 1 Favorite
Mood 0
-
Underlying graph from this thread: @Avik/1276504439776559104On twitter.com
❤️ 1 Favorite
Mood 0
-
Caveats: doing statistics during a moving pandemic is hard. Denominator is too low, perhaps by a factor of 4+, because many people haven't been tested. Numerator is too low because many tested people haven't been hospitalized yet.Permalink On twitter.com
❤️ 1 Favorite
Mood -3 🙁